Contents
Introduction
This page will show you how to use the quick functions to easily use your TiePie engineering measuring instrument as different virtual instruments: oscilloscope, spectrum analyzer, data logger or voltmeter.
The quick functions can be accessed via the main menu and the quick functions toolbar.
Available functions
The easiest way to use the quick functions, is to use the buttons on the quick functions toolbar, but they can also be accessed via the main menu.
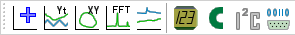
The available quick functions are listed in the following table.
| Icon | Action | Short description |
|---|---|---|
 |
Create new graph | Create a new, empty graph |
 |
Create Yt graph | Create a Yt graph for the active instrument |
 |
Create XY graph | Create an XY graph for the active instrument |
 |
Spectrum analyzer | Create a spectrum graph for the active instrument |
 |
Data logger | Set the active instrument to streaming mode and make a data logger graph |
 |
Create voltmeter | Create a voltmeter for the active instrument |
 |
CAN decoder | Create a CAN decoder I/O and connect it to the active instrument |
 |
I2C decoder | Create a I2C decoder I/O and connect it to the active instrument |
 |
UART / Serial decoder | Create a UART / Serial decoder I/O and connect it to the active instrument |
Quick functions act on the active instrument, in the program settings can be determined on which channels the quick functions act.
An example of each function is given in the following sections. A Handyscope HS3 is used, but other instruments supported by the Multi Channel oscilloscope software can also be used.
New Graph
To create a new, empty graph, click the
Add graph
button on the quick function toolbar.
This will create a new graph in the in the area of the largest available graph, dividing that area in two.
When the width of the area is larger than √2 times its height, the new graph will be
created next to the existing graph.
Otherwise, it will be created below it.
The new graph will be made the active graph.
Oscilloscope
An oscilloscope can be used to display measurements against time (Yt mode) or to display one channel against another (XY mode). You can manually set a graph to either Yt or XY mode, and drag the desired channels into the graph, or you can use the Yt or XY quick functions.
Information about using graphs can be found in the graph section. To learn more about basic measurements, read the digital data acquisition page and the triggering page.
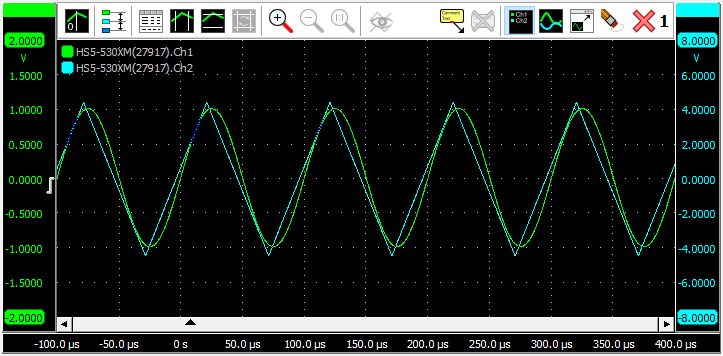
Yt mode
To use the active measuring instrument as an oscilloscope in Yt mode, click the
Yt mode
button on the quick function toolbar.
The channels of the active instrument will be shown in an empty graph. A new graph will be created when no empty graph is present. The new graph will be made the active graph.
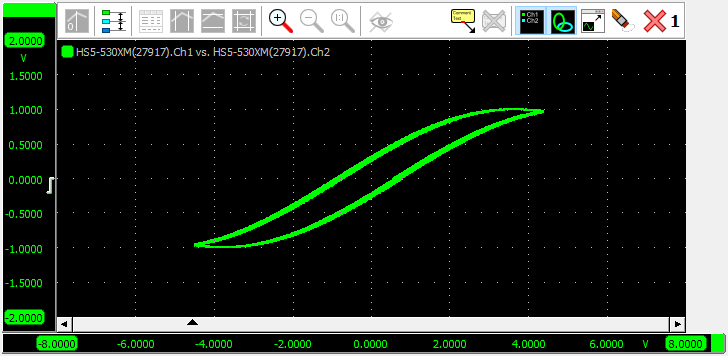
XY mode
To use the active measuring instrument as an oscilloscope in XY mode, click the
XY mode
button on the quick function toolbar.
Channels 1 and 2 of the active instrument will be shown in an empty graph. A new graph will be created when no empty graph is present. The new graph will be made the active graph.
This function is disabled when the active instrument has less than two channels.
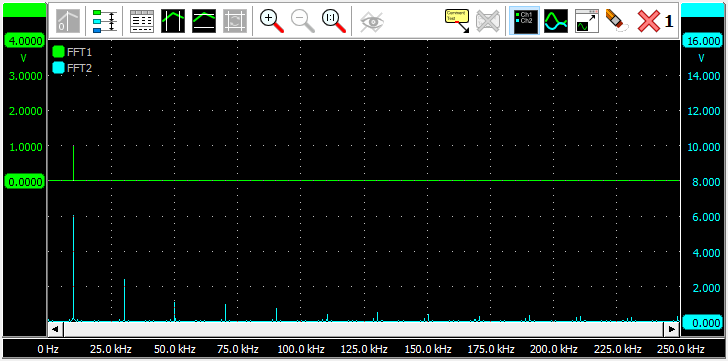
Spectrum analyzer
To use the active measuring instrument as a spectrum analyzer, click the
Spectrm analyzer button on the quick function toolbar.
An FFT object will be created and connected to each channel of the active instrument. The FFT objects convert the measured time base signals to a spectrum by means of a Fast Fourier Transform. Its window function is set to Flat top. The outputs of the newly created FFT objects will be shown in an empty graph. A new graph will be created when no empty graph is present. The new graph will be made the active graph.
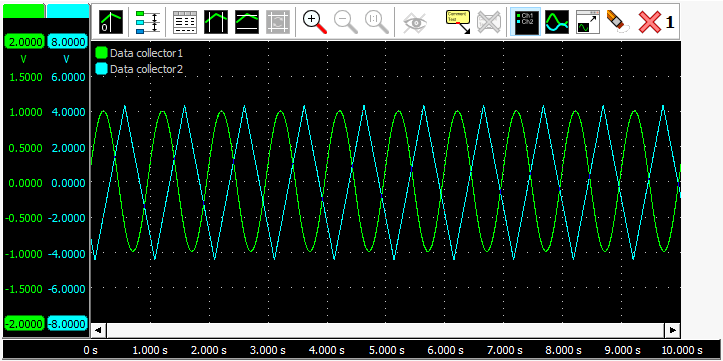
Data logger
To use the active measuring instrument as a data logger, click the
Data logger button on the quick function toolbar.
The active instrument will be set to streaming mode and a data collector object will be created and connected to each channel of the active instrument. The outputs of the newly created data collector objects will be shown in an empty graph. A new graph will be created when no empty graph is present. The new graph will be made the active graph.
The data logger is usually used for relatively slow signals. The instrument is set to streaming mode. The advantages over normal scope mode operation are:
- The measurement display is constantly updated during the measurement. You don't have to wait until the whole measurement is completed to see the result.
- Longer measurements are possible than would fit in the instrument's memory in normal scope operation.
Read more about the differences between scope mode and streaming mode on the streaming measurements page.
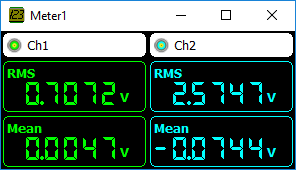
Voltmeter
To use the active measuring instrument as a voltmeter, click the
Meter button on the quick function toolbar.
The channels of the active instrument will be shown in a newly created meter object.
By default, the measurements "Mean" and "RMS" are enabled. Other measurements can be added for each channel. Examples are: minimum, maximum, top-bottom, variance, standard deviation, frequency and for frequency data: Total Harmonic Distortion.
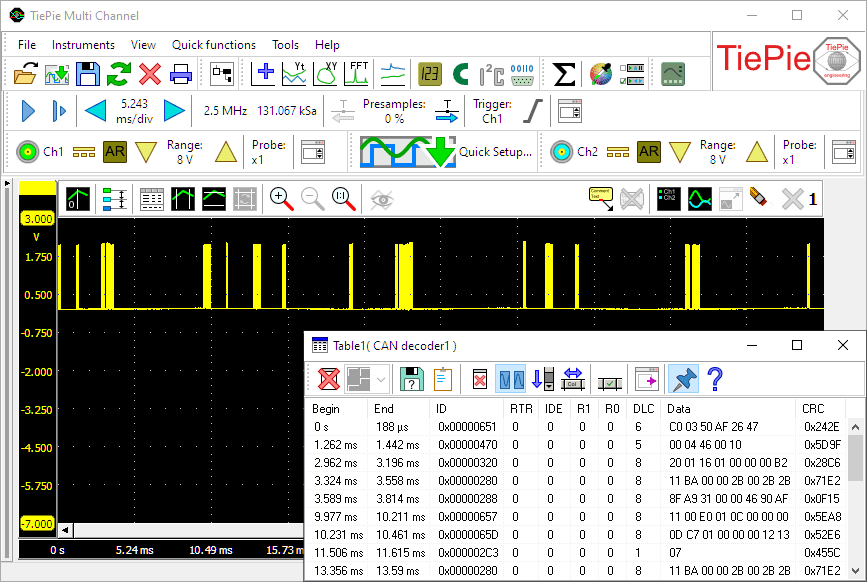
CAN decoder
To use the active measuring instrument as a CAN decoder, click the
CAN decoder button on the quick function toolbar.
A new CAN decoder I/O will be created and connected to
an newly created table sink to display the decoded CAN data.
If the active instrument has two or more channels, the user is asked whether one or two channels should be used. When two channels are used, both the CAN high and CAN low signal should be measured. The difference signal H-L is calculated with a Add / Subtract I/O and fed into the analyzer. If only one channel is used, this may measure CAN high, or the differential CAN signal H-L. The latter is only possible with a differential input.
I2C decoder
To use the active measuring instrument as a I2C decoder, click the
I2C decoder button on the quick function toolbar.
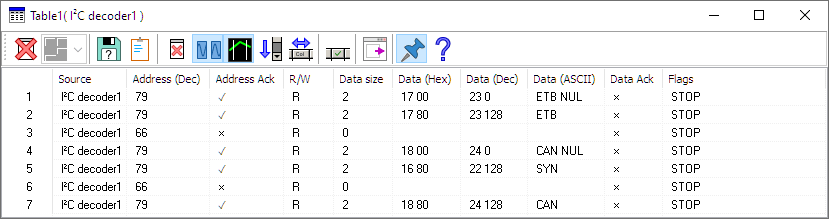
A new I2C decoder I/O will be created and connected to
the first two channels of the active instrument and connected to
an newly created table sink to display the decoded I2C data.
The I2C decoder can only be used with instruments with two or more channels.
The first channel will be used as I2C SCL (clock) and the second as I2C SDA (data).
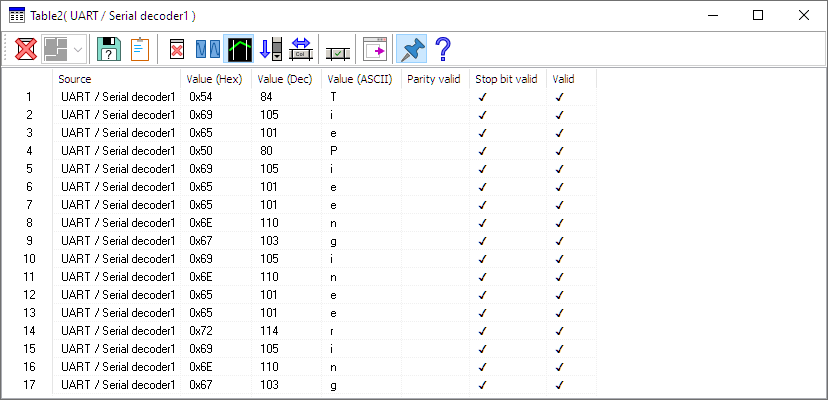
UART / Serial decoder
To use the active measuring instrument as a serial decoder, click the
UART / Serial decoder button on the quick function toolbar.
A new UART / Serial decoder I/O will be created and connected to
the first active channel of the active instrument and connected to
an newly created table sink to display the decoded UART / Serial data.
It can be used to analyze RS232, RS485, MIDI, DMX or other compatible serial buses.