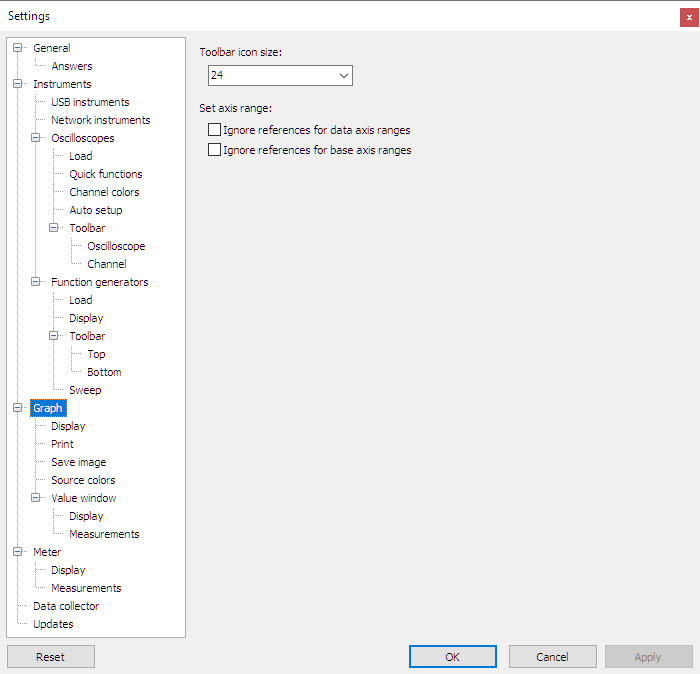
Toolbar icon size
The size of the icons on the graph toolbar can be changed to predefined as well as user defined values.
Hint:
When using a touch screen, increasing the icon size will make it easier to click tool buttons.
Set axis range
The graph scales are designed such that their range fits the ranges of all signals that are attached to it. This can be a problem when a scale is shared between a live signal and a reference signal, and the live signal is much smaller than the reference signal. The live signal will then hardly be visible.
To prevent this, two options are available to ignore reference ranges:
- The setting Ignore references for data axis ranges causes reference ranges to be ignored by vertical scales, as well as horizontal scales in XY mode.
- The setting Ignore references for base axis ranges causes reference ranges to be ignored by horizontal time and frequency scales.