
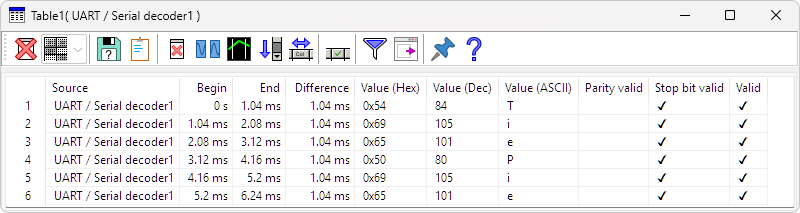
The table sink shows values in a table. The table can display both numerical and string values. The values contained in the source's data are displayed in multiple columns. Columns can be hidden or shown via the dedicated toolbutton of via the popup menu that can be accessed by right-clicking the column header. The rows in the table can be sorted by the values in a certain column, by clicking on the column header. Data in the table can be saved to various common file formats.
Connecting a source can be done in two ways:
- drag the source onto the table in the object screen
- drag the source onto the window of the table.
To locate data shown on a specific row in the table in the corresponding graph showing the same data, make sure that graph is the active graph. Then double click the row in the table. The active graph will now horizontally zoom in at the data presented in the table row.
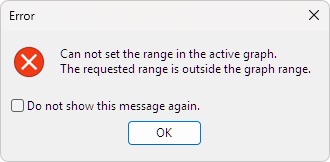
When the table is set to "Collect" and contains data from multiple measurements, it can be that the line that is double clicked belongs to a previous measurement. In that case, the active graph can not zoom in at the corresponding data and a message is displayed:
Filtering the table content
When e.g. decoding serial communication and presenting the decoded data in a Table, the table can be filled with a large amount
of data, while only certain rows are interesting.
Using the Filter  option
will open the Filter toolbar.
option
will open the Filter toolbar.
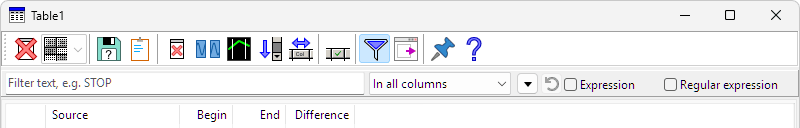
The Filter bar gives several options to filter the data in the Table:
- A Filter text field, where the text to filter on can be entered
- A column selector, to indicate which column(s) will be used to filter on
- Filter history control
- Filter reset
- Filter using expressions
- Filter using regular expressions
Filtering on the displayed text
When filtering based on the displayed text, the text that needs to be found can be entered in the Filter text edit box. Searching text is done case insensitive. All rows where the entered text is found will be displayed in the table, all other rows, not containing that text will be hidden.
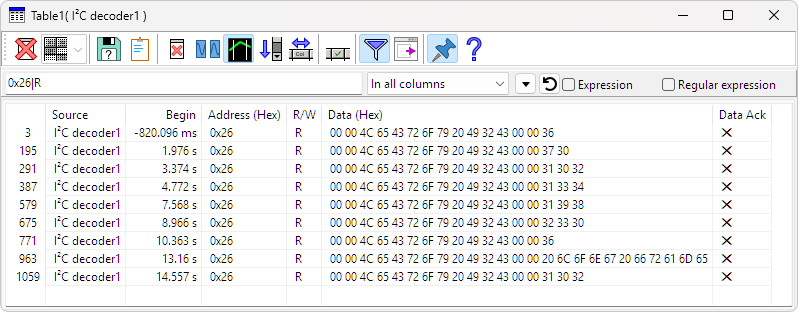
Depending on the setting of the column selector, searching is either done in In all columns or in the selected column only. When In all columns is selected, the texts from the different visible columns are glued together with '|' characters in between. That allows to filter on specific texts occurring in adjacent columns in the table. Below an example of an I2C communication, before filtering.
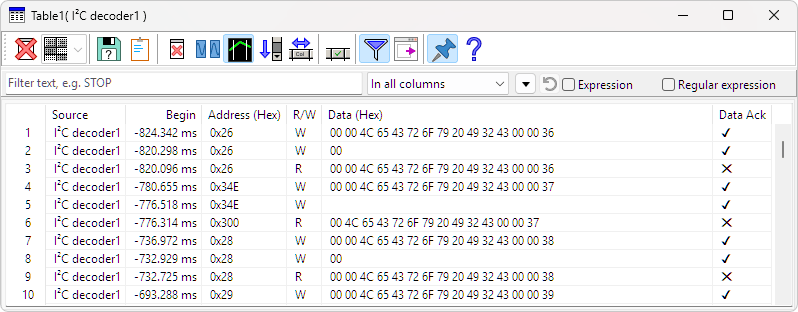
When e.g. all occurrences in an I2C communication where address 0x26 is accessed have to be filtered out, and only Read instructions need to be shown, the filter text can be set to 0x26|R. This combines the values in the Address column and the R/W column, glued together with a '|'.
Certain columns that contain boolean values, e.g. a "Valid" or "Ack" column, can contain special characters like ✓ and ✕. To search these, it is possible to use v and x.
To reset the table filter and show the complete table content again, click the Filter reset
 button
Filter history
The Filter history  button
gives access to a pulldown with previously used filters and filter history options.
button
gives access to a pulldown with previously used filters and filter history options.
Used filters are stored in the table instance, each table has its own filter history. When filters are used in a table and the setup is saved to disk in a .TPS file, the filters are stored with the table in the .TPS file. Restoring the saved setup will also return the used filters in that table.
Manage
When a filter is active, the Manage option in the filter history allows to perform additional actions to the active filter.
- Pin This pins the current active filter to the Filter history, in a separate section. When the measurement setup is saved to disk in a .TPS file or .TPO file, the filter is saved with it.
- Pin to settings This pins the active filter to the Multi Channel oscilloscope software application settings ini file. Any new table that is created will have this filter in its history, listed in a separate section in the filter history.
- Delete This removes the pin from this filter and also from the Multi Channel oscilloscope software application settings ini file when applicable.
Regular expression
By enabling Regular expression, the filter will use Perl regular expressions to filter out the table data. This allows for more versatile filtering, e.g. filtering on the contents of two columns that are not directly adjacent. Below an example of an I2C communication, before filtering.
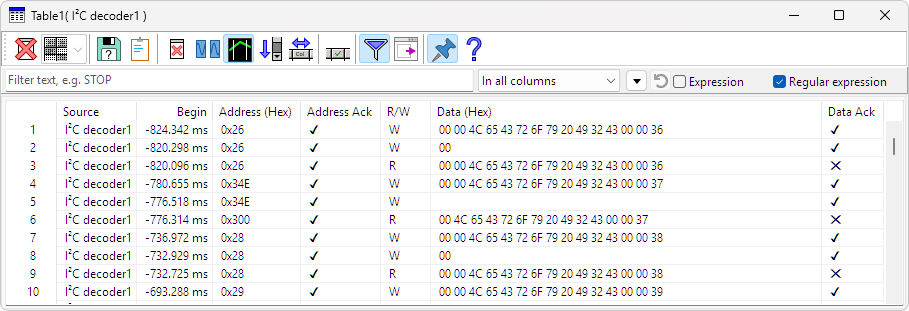
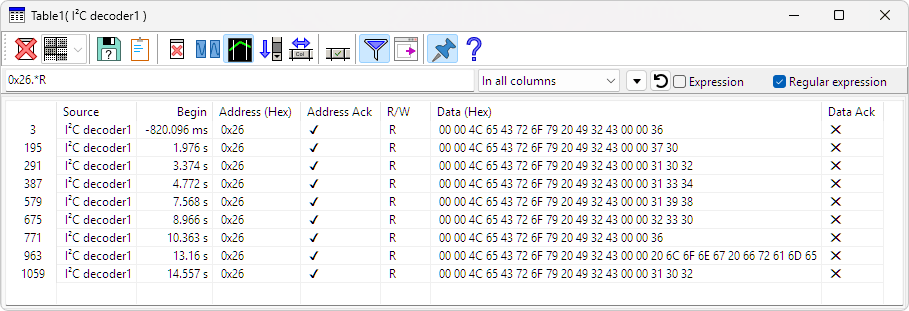
Again all occurrences in this I2C communication where address 0x26 is accessed have to be filtered out, and only Read instructions need to be shown, but these columns are not adjacent. By enabling Regular expression and setting the filter text to 0x26.*R, the regular expression will look for any occurrence of "0x26", followed by any number of random characters and then an "R".
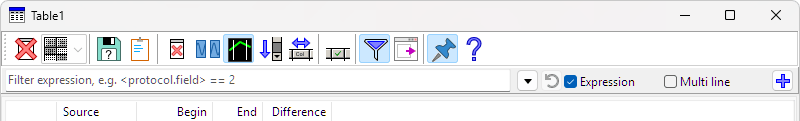
Filter using expressions
Even more filtering options become available when enabling Expressions, which gives access to a Lua scripting engine that allows to build much more powerful filtering expressions.
Expressions that contain a syntax error will be colored red. Expressions that cause an error when evaluating will be colored orange. When hovering the colored expression, a hint will show the error.
Filter expression are created from one or more variables, expressions, statements and functions, combined by operators. The most important operators are:
- and
- or
- not
- == ( is equal to )
- ~= ( is unequal to )
Numbers in hexadecimal format are written as e.g. 0x123.
To indicate a text string, use either ' ' or " " around the string, e.g. 'text' or "text".
The  button opens an Expression snippets
window, in which various different parts for the filtering expression can be selected.
button opens an Expression snippets
window, in which various different parts for the filtering expression can be selected.
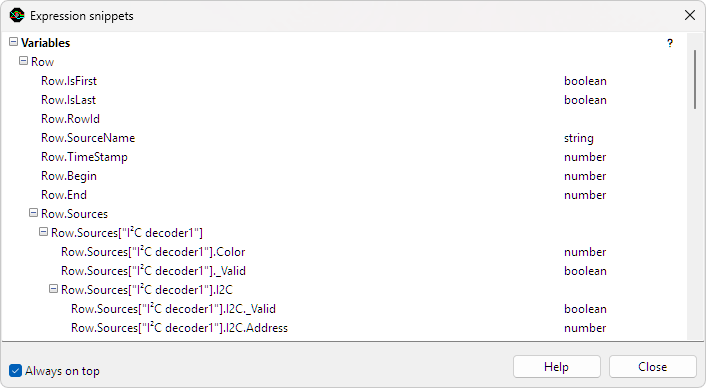
To use an expression snippet in the filter expression, double-click it in the selection window to transfer it to the expression.
The variables to filter on can be selected in the Expression snippets window, under Variables. Only variables present in the current row of the table are shown. When additional information is available for a "snippet", a small arrow is shown on that line; clicking that arrow will open a page with the additional information.
Variables can have different types:
- boolean: True or False, in the Table shown as ✓ or ✕
- number: an integer or floating point number, shown in decimal or hexadecimal notation.
- string: some text, e.g. 'R' or 'W' or ' 1.234 ms'
- byte string: an array of bytes, e.g. '0 0 76 101 67 114 111 121 32'
Variables of type 'byte string' can be indexed. The first byte has index 1. Example:
Row.Sources["I²C decoder1"].I2C.Data[3] == 0x4C
Variables of type 'string' can not be indexed.
Variables can be empty or non-existent for a certain row. In that case, these variables return nil or return a table with empty fields, allowing expressions to be evaluated for all rows, otherwise an error would occur. Whether a table is valid or empty can be verified with ._Valid.
For converting bytes/bits into numbers, special unpack functions are available, under in the Expression snippets window.
Two more useful functions for filtering are:
| in_array( value , values ) |
test whether 'value' is present in table 'values', a table is indicated with {}. Example: in_array( Row.Sources["I²C decoder1"].I2C.Data[3],{0x4C , 0x65}) shows all rows where column Data has value 0x4C or value 0x65 at index 3. |
|
| last( .... ) |
Returns always true, but hides all previous rows with the same arguments. Example: last(Row.Sources["I²C decoder1"].I2C.Address, Row.Sources["I²C decoder1"].I2C.Flags.Read) shows the last row for each different address that was read and the last row for each different address that was written. |
When filter expressions are intended to be saved in .TPS set files, it is best to give the table source(s) an alias. That way references stay intact when the set file is loaded again, as objects can get renumbered when loading a set file.
It is often possible to use shorter variable names. E.g. instead of the variable Row.Sources["decoder"].I2C.Address, it is also possible to use one of the following:
- Row.Sources.decoder.I2C.Address
- decoder.I2C.Address
- I2C.Address
Advanced filtering options
Besides expressions, it is also possible to enter Lua script pieces. The script is executed for each new table row. Script pieces must return a boolean result with 'return <result>'. This result must be True to show a row, False to hide a row. When nothing is returned, this is seen as a False. For expressions internally a 'return' is placed in front of the text. If this causes a syntax error, then is checked if without the added 'return' the syntax is correct.
Each table sink gets one Lua environment, that remains existent until the table is closed. This environment is initialized by executing the script TiePie.lua. User functions can be placed in the file UserCode.lua. In the environment a table SANDBOX is created, with a sub set of the Lua environment. This is the environment the filter only sees, to avoid that a set file can execute malicious code.
When applying a filter when new data is added, the filter script is called per row in order of arrival. When executing again with the Play button or by pressing Enter again, the script is called per table row in table order. To keep track of the table state between subsequent calls, there is a special table 'Filter_state'. This table is cleared when executing a filter again.
The current row is represented in the filter by the table 'Row', this has some special fields:
| Row.RowId | This is the handle for a row, which can be used to e.g. hide a row by using the function 'set_row_visible'. This handle can be saved and used again later. | |
| Row.IsFirst | Returns 'True' for the first row in the table. | |
| Row.IsLast | Returns 'True' for the last row in the table. |
Special functions:
| set_row_visible( rowid, visible ) | This is used to show or hide a row. The function 'last' uses this and keeps a state in 'filter_state.last_state'. |
Displaying text
Besides returning True or False, the script can also display text.
Strings in Lua are in bytes, when displaying a string it is assumed that the bytes are a utf-8 string.
| For standard Lua printing, each value on a new line. | ||
| write_output | Like text, but not on a new line. | |
| set_output_font | To set the current font. Example: to set a monospace font: set_output_font ('Cascadia Mono') |
|
| set_output_color | To set the current text color with an RGB value. 0xFF0000 = blue, 0x00FF00 = green, 0x0000FF = red. It is possible to use the source color. |
|
| set_output_bold | To enable or disable bold face text. | |
| clear_output | To clear a text field. The table is cleared when a filter is executed again. |
Numbers will be shown as numbers, to convert a number to text, use the following functions.
| char | numbers from 0 .. 255 to bytes that are seen as utf-8 string. Example: printchar(230,161,129)) gives 桁 |
|
| utf8.char | A number representing a Unicode character to utf-8. Example: print(utf8.char( 0x6841)) gives 桁 |
|
| bytes_to_utf8(bytes, to_text_options, windows_code_page) | When a Lua string is to be seen as bytes and a different encoding than utf-8 is used, this function can be used to convert it to utf-8 and optionally do extra conversion(s). The options are: |
| to_text_options.control_skip | char(27) → '' | |
| to_text_options.control_remap | char(27) → ? | |
| to_text_options.control_brackets_unicode | char(27) → '[u+001b]' | |
| to_text_options.control_brackets_dec | char(27) → '[27]' | |
| to_text_options.control_brackets_hex | char(27) → '[0x1b]' | |
| to_text_options.control_brackets_mnemonic | char(27) → '[ESC]' | |
| to_text_options.control_print_cariage_return | When converting control characters, do start on a new line anyway | |
| to_text_options.control_print_newline | When converting control characters, do start on a new line anyway | |
| to_text_options.control_print_tab | When converting control characters, do print a normal tab |
These options can be OR'ed with a '|'
The windows_code_page is a number, see Windows code page.
Properties and actions
To control the behavior of the table sink, several properties and actions are available. These can be accessed through a toolbar with buttons at the top of the table window and through a popup menu which is shown when the sink is right clicked in the Object screen.
Reset
The Reset action ( )
resets the table, clearing the table, including the header row.
The Reset action is available as button on the toolbar and in the popup menu.
)
resets the table, clearing the table, including the header row.
The Reset action is available as button on the toolbar and in the popup menu.
Layout
When a table has more than one source, the Layout setting determines what happens with data from different sources that has either the same time stamp or uses the same column(s).
-
When set to Common columns
 , data from different sources that have a common value will end up on different rows, but
share that column.
, data from different sources that have a common value will end up on different rows, but
share that column.
-
When set to Common rows
 , data from different sources that have a common value will end up on the same row, but will
add extra column(s).
, data from different sources that have a common value will end up on the same row, but will
add extra column(s).
-
When set to No common
 , data from different sources will end up on different rows and each value for each source will
get its own column.
, data from different sources will end up on different rows and each value for each source will
get its own column.
The layout of a table can only be set before the sources are connected.
Export data
The Export data action ( )
saves the content of the table to a file.
When lines are selected in the table, only the selected lines are exported.
When no lines are selected, all lines are exported.
)
saves the content of the table to a file.
When lines are selected in the table, only the selected lines are exported.
When no lines are selected, all lines are exported.
Various file types are available to save the data to:
- HTML format (*.html)
- Rich Text Format (*.rtf)
- CSV (*.csv)
- Unicode text (*.txt)
- Plain text (*.txt)
The Export data action is available as button on the toolbar and in the popup menu.
Copy to clipboard
The Copy to clipboard action ( ) copies the content of the table including layout to the Windows clipboard, from where it can be
pasted in various applications.
The Copy to clipboard action is available as hotkey Ctrl +
C and as button on the toolbar.
) copies the content of the table including layout to the Windows clipboard, from where it can be
pasted in various applications.
The Copy to clipboard action is available as hotkey Ctrl +
C and as button on the toolbar.
Clear
The Clear action (![]() )
clears the table but leaves the header row intact.
The Clear action is available as button on the toolbar and in the popup menu.
)
clears the table but leaves the header row intact.
The Clear action is available as button on the toolbar and in the popup menu.
Collect data
The Collect data setting ( )
determines whether the table collects all data or or only shows the last data.
When enabled, new data will be added to the table, increasing the table length.
When disabled, the table is first cleared when new data is shown.
)
determines whether the table collects all data or or only shows the last data.
When enabled, new data will be added to the table, increasing the table length.
When disabled, the table is first cleared when new data is shown.
Set graph cursors
When double clicking a row in the table, the active graph will horizontally zoom in to the part of the signal that
corresponds to the table row.
When the setting Set graph cursors ( ) is enabled, vertical cursors will be placed in the graph, marking the begin and end of the
part of the signal that corresponds to the table row.
) is enabled, vertical cursors will be placed in the graph, marking the begin and end of the
part of the signal that corresponds to the table row.
Auto scroll to bottom
The Auto scroll to bottom property ( ) makes the table scroll to the bottom of its
content each time new data has arrived, making the latest data visible.
The Auto scroll to bottom property is available as button on the toolbar.
) makes the table scroll to the bottom of its
content each time new data has arrived, making the latest data visible.
The Auto scroll to bottom property is available as button on the toolbar.
Auto size columns
The Auto size columns action ( ) sets the width of all visible columns to a size that fits all data and the header.
The Auto size columns action is available as button on the toolbar.
) sets the width of all visible columns to a size that fits all data and the header.
The Auto size columns action is available as button on the toolbar.
Select columns
The Select columns ( ) button allows to select which columns are shown and which columns are hidden.
Pressing the button will show a selection dialog that shows all available columns.
) button allows to select which columns are shown and which columns are hidden.
Pressing the button will show a selection dialog that shows all available columns.
Show source's settings window
The button Show source's settings window ( ) opens the settings window of the source connected to the table.
When multiple sources are connected to the table, a menu is shown to select the required source.
) opens the settings window of the source connected to the table.
When multiple sources are connected to the table, a menu is shown to select the required source.
Always on top
When the Always on top property ( ) is switched on, the table window cannot be hidden
under other windows of the Multi Channel oscilloscope software.
The Always on top property is available as button on the toolbar and in the popup menu.
) is switched on, the table window cannot be hidden
under other windows of the Multi Channel oscilloscope software.
The Always on top property is available as button on the toolbar and in the popup menu.
Bring to front
When the table window is hidden behind another window in the Multi Channel oscilloscope software, the action Bring to font will make it visible. The Bring to front action is available in the popup menu.
Common properties and actions
Related information

Pulse decoder
The Pulse decoder I/O decodes the two signals from a quadrature encoder to a pulse count/position.
I2C decoder
The I2C decoder I/O decodes analog data on the SDA and SCL lines of an I2C bus to I2C data.
UART / Serial decoder
The UART / Serial decoder I/O decodes analog data on a UART, RS232, RS485, MIDI, DMX, LIN or other compatible serial bus to serial data.
CAN decoder
The CAN decoder I/O decodes analog data to CAN data.
J1939 decoder
The J1939 decoder I/O extracts SAE J1939 SPN values from CAN messages.
SPI decoder
The SPI decoder I/O decodes analog data on an SPI bus to SPI data.
LIN decoder
The LIN decoder I/O decodes analog data on a Local Interconnect Network bus to LIN message data.
SENT decoder
The SENT decoder I/O decodes analog signals on a SENT bus to SAE J2716 SENT messages.
DMX512 decoder
The DMX512 decoder I/O decodes analog signals on a DMX512 bus to DMX512 messages.