Contents
Safety warning
Most TiePie engineering measuring instruments are not designed to handle the voltages that are normally present on a mains power outlet. When your instrument is not suited to measure these voltages, the use of a differential probe, like the Differential probe SI-9002 is highly recommended. If you do not use the Differential probe SI-9002, it is likely that your measuring equipment is damaged permanently!
Differential probe SI-9002

The Differential probe SI-9002 is an active differential probe, designed to give your single ended instrument a high voltage differential input. This example will show how it can be used to measure a mains power outlet.
Setting up the probe
Before you start measuring, make sure that the Differential probe SI-9002 is powered by either batteries or an external power adapter. Do not connect any cables yet and check if the power led is lit when you switch the power button to '1'. Turn the Differential probe SI-9002 off again after you have verified that it is properly powered.
Next, verify that the attenuation ratio is set to 1/200. If this ratio is set lower, it might also damage your equipment! Once you are certain that the Differential probe SI-9002 is set up correctly, connect the BNC connector to any channel of your TiePie engineering measuring instrument. The final step is to connect the differential probe to the mains power outlet. Based on your region, you may need an adapter to connect the differential probe to the outlet.
Measuring the power outlet
Setting up the channel
Once the differential probe has been properly set up, start the software. The Differential probe SI-9002 outputs a voltage that is related to the voltage it measures. The channel must be compensated to convert the measured voltage to the original voltage value.

To do that, go to the channel toolbar and select the Differential probe SI-9002 (1/200) using the Probe button. This will automatically set the channel's probe gain setting to the correct value. The Differential probe SI-9002 can be used in two different input ranges, which each have their own entry in the Probe menu.
Using the oscilloscope
With the Differential probe SI-9002 connected and the software setup properly, the Differential probe SI-9002 can now be switched on and a measurement performed.
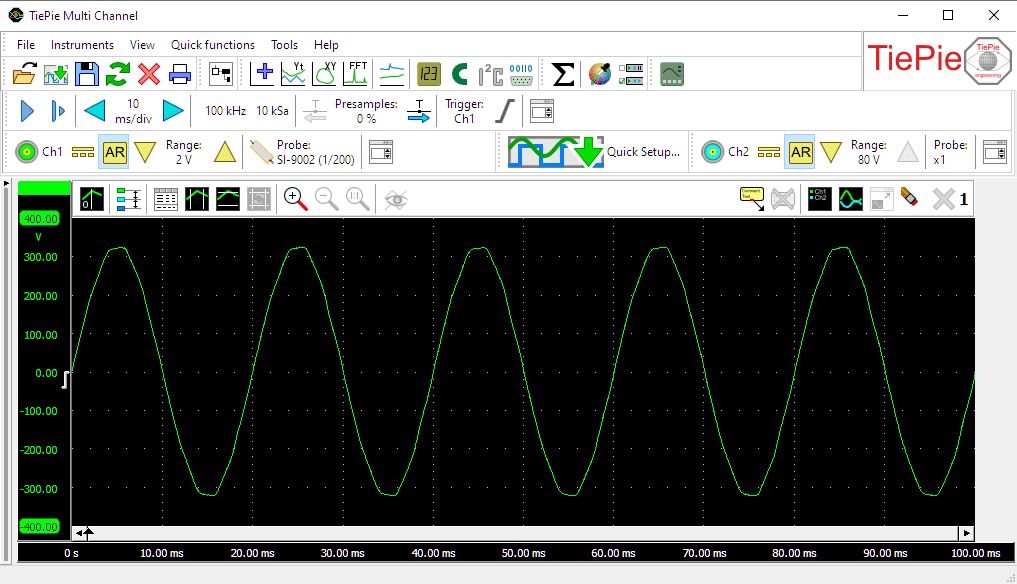
Note that the oscilloscope does not display 230V (for Europe) or 110V (for North America) since the oscilloscope only shows the peak-peak voltage between the two peaks of the sine wave, instead of the RMS value in which the voltage on the power outlet is listed.
Using a meter
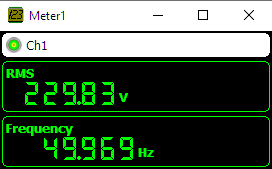
To measure the RMS voltage of the mains power outlet, the Meter sink can be used. The meter can also be used to measure the mains frequency.
Right-click the Sinks entry in the object tree and select Meter. Then drag Ch1 of your instrument on the meter sink you just created. A meter display now appears, showing some measurements of Ch1. Right-click each display and change the measurements to the appropriate measurements, in this case RMS and Frequency.
Using a spectrum analyzer
As can be seen above, in the image of the oscilloscope, the sine wave of your power outlet is not exactly your typical sine. A lot of distortion occurs, resulting in a somewhat square top end of the wave. This is, off course, an interesting phenomenon that calls for further investigation. The spectrum analyzer is the ideal instrument for all frequency related information, therefore we will use it to get a quick insight in the distortion figures on the power outlet.
To open a spectrum analyzer, locate the  FFT button on the quick function toolbar and click it.
FFT I/O's are created and connected to the channels of the instrument,
a new graph is created and the FFT I/Os are placed in the graph.
When required, you can set the vertical axes to logarithmic by right-clicking each axis and
selecting Logarithmic from Axis type.
FFT button on the quick function toolbar and click it.
FFT I/O's are created and connected to the channels of the instrument,
a new graph is created and the FFT I/Os are placed in the graph.
When required, you can set the vertical axes to logarithmic by right-clicking each axis and
selecting Logarithmic from Axis type.
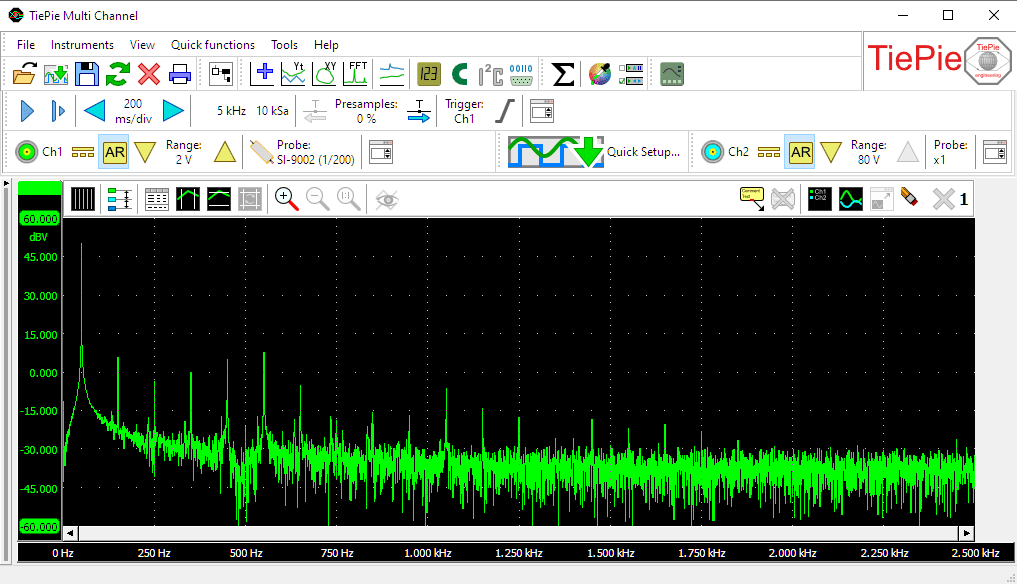
The spectrum of the power outlet that was used to create the images on this page shows that the 3rd harmonic is pretty much non-existent, but the 5th harmonic (at 250 Hz) is a lot bigger again. As we further progress in the spectrum, the amplitudes of the peaks are further decreasing, but still present. This explains the 'flat' top ends of the sine wave from the power outlet.
The amount of distortion in the signal can be determined by calculating the THD of the measured signal. This can be done by adding a THD measurement to the Meter display or by switch on the cursors and adding a THD measurement there.