This introduction will show you some examples to get started working with the software. A Handyscope HS5 is used in most of the examples, but other instruments supported by the Multi Channel oscilloscope software can also be used.
When started without instrument connected, the Multi Channel oscilloscope software operates as demo software.
Start application
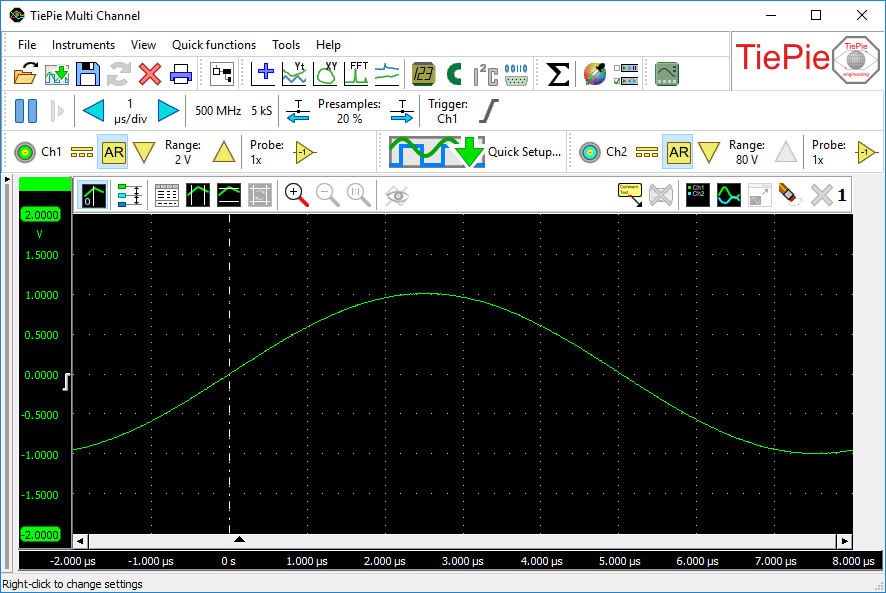
When you start the application the screen will look like figure 1.
Application sections
The main window of the application is divided into three sections which will be described in the next paragraphs.
Toolbars
A few toolbars are situated directly below the main menu. The first toolbar can be used for accessing frequently used items from the file menu. The other toolbars contain quick functions to use the measurement instruments as a standard virtual instrument: oscilloscope, spectrum analyzer, data logger or voltmeter and other function in the software.
Instrument controls
Instruments can be controlled with the instrument toolbar and the channel toolbars. More information about controlling instruments can be found in the instrument controls section.
Graph section
Below the instrument bar, the graph windows are situated. The graphs can show the acquired measurements, other sources and outputs of I/O blocks. An output of an I/O block can for example be low-pass filtered measured data. More information about graphs can be found in the graph section.
Object screen
At the left on the main form, the object screen is situated.
In the object screen the different in- and output blocks can be connected.
It is either setup as Object Tree or as Object Schema.
The object screen is closed by default, and can be opened by clicking the
 Object screen button.
More information about the object screen can be found in the object screen section.
Object screen button.
More information about the object screen can be found in the object screen section.
Edit fields for numerical values
In many locations in the software, it is possible to enter a numerical value, e.g. to set the gain value of a Gain / Offset I/O.
Entering numbers can be done in various ways:
- as plain number, e.g. 1200
- in scientific notation, e.g. 1.2e3
- using prefixes, e.g. 1.2k or 1k2
- as an expression, e.g. 10 * ( 100 + 20 )
Valid prefixes that can be used in edit fields are:
| Prefix | Name | Value |
|---|---|---|
| f | femto | 1e-15 |
| p | pico | 1e-12 |
| n | nano | 1e-9 |
| µ or u | micro | 1e-6 |
| m | milli | 1e-3 |
| k | kilo | 1e3 |
| M | mega | 1e6 |
| G | giga | 1e9 |
| T | tera | 1e12 |
| P | peta | 1e15 |
Prefixes are case sensitive!
Expressions can besides numbers also use parentheses (always in pairs), constants and mathematical functions. These are case insensitive. Supported constants are:
| Constant | Value |
|---|---|
| pi | 3.141592638 |
| eulersnumber or en | 2.718281828 |
Supported functions are:
| Function | Description |
|---|---|
| sin( Arg1 ) | returns the Sine of angle Arg1 in degrees |
| cos( Arg1 ) | returns the Cosine of angle Arg1 in degrees |
| tan( Arg1 ) | returns the Tangent of angle Arg1 in degrees |
| arcsin( Arg1 ) | returns the angle in degrees of the ArcSine of value Arg1 |
| arccos( Arg1 ) | returns the angle in degrees of the ArcCosine of value Arg1 |
| arctan( Arg1 ) | returns the angle in degrees of the ArcTangent of value Arg1 |
| arctanxy( Arg1, Arg2 ) | returns the angle in degrees of the ArcTangent of Arg2 / Arg1 |
| degtorad( Arg1 ) | converts angle Arg1 in degrees to an angle in radians |
| radtodeg( Arg1 ) | converts angle Arg1 in radians to an angle in degrees |
| sqr( Arg1 ) | retuns the square of a value Arg1 |
| sqrt( Arg1 ) | returns the square root of a value Arg1 |
| ln( Arg1 ) | returns the natural logarithm of value Arg1 |
| log10( Arg1 ) | returns the ten base logarithm of value Arg1: 10log Arg1 |
| log2( Arg1 ) | returns the two base logarithm of value Arg1: 2log Arg1 |
| logn( Arg1, Arg2 ) | returns the Arg1 base logarithm of value Arg2: Arg1log Arg2 |
| exp( Arg1 ) | returns e (euler's number) to the power Arg1: eArg1 |
| power( Arg1, Arg2 ) | returns Arg1 to the power Arg2: Arg1Arg2 |
| ceil( Arg1 ) | returns the nearest integer that is equal to or greater than value Arg1 |
| floor( Arg1 ) | returns the nearest integer that is equal to or less than value Arg1 |
| round( Arg1 ) | rounds value Arg1 |
| trunc( Arg1 ) | returns the integer part of the floating point value Arg1 |
| mod( Arg1, Arg2 ) | returns the remainder of Arg1 divided by Arg2 |
| div( Arg1, Arg2 ) | returns the whole number result of Arg1 divided by Arg2 |
Any expression that is entered, will be evaluated by the software and the resulting value is used. The expression will be kept, to make later changes easier. The expression is also saved when saving a setup to a .TPS file and reloaded when that file is later reloaded.