In the cursor window of each graph and in meters, various different measurements can be selected. These measurements include:

In the cursor window the following additional measurements are possible:
| Icon | Measurement |
|---|---|
 |
Left |
 |
Right |
 |
Right-Left |
 |
Slope |
 |
Top |
 |
Bottom |
 |
Top-Bottom |
Short description
This section gives a short description of the standard measurements for the meter and cursors.
The measurements are calculated over a sample range. In a graph, when using the cursor window with the vertical cursors switched on, the sample range is equal to the samples in between the left and right vertical cursor. When the vertical cursors are switched off, the sample range is equal to the post samples.
In a meter object, the sample range is determined by the Meter setting Measurement data range.
Some measurements are explained with a formula. In these formulas the following applies:
- m corresponds to the index of the first sample in the sample range
- n corresponds to the index of the last sample in the sample range
- N is the number of samples in the sample range and is equal to n - m + 1
- xi corresponds to the ith sample
Momentary
The measurement  Momentary gives a momentary value of the measured signal.
It is the last, or right-most value in the sample range.
Momentary gives a momentary value of the measured signal.
It is the last, or right-most value in the sample range.
Maximum
The measurement  Maximum is the highest value in the sample range.
Minimum
The measurement  Minimum is the lowest value in the sample range.
Maximum-Minimum
The measurement  Maximum-Minimum, also known as peak-peak is the highest value in the sample range minus the lowest value.
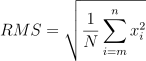
Root Mean Square (RMS)
The measurement  RMS
is equal to the square root of the mean of the squares of all samples in the sample range:
RMS
is equal to the square root of the mean of the squares of all samples in the sample range:
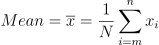
Mean
The measurement  Mean
is the mean value of all samples in the sample range.
Mean
is the mean value of all samples in the sample range.
Variance
The measurement  Variance is a measure of how values are distributed around the mean value.

Standard Deviation
The measurement  Standard deviation (σ) is equal to the square root of the variance.
The standard deviation is equal to the RMS value for signals with a zero mean value (AC signals).
Standard deviation (σ) is equal to the square root of the variance.
The standard deviation is equal to the RMS value for signals with a zero mean value (AC signals).

Frequency
The measurement  Frequency determines the frequency of a time based signal.
The frequency is determined by searching the rising slopes in a signal and measuring the time between them.
Frequency determines the frequency of a time based signal.
The frequency is determined by searching the rising slopes in a signal and measuring the time between them.
For a correct measurement, at least two rising slopes must be present in the sample range.
Period
The measurement  Period determines the period time of a time based signal.
The period time is determined by searching the rising slopes in a signal and measuring the time between them.
Period determines the period time of a time based signal.
The period time is determined by searching the rising slopes in a signal and measuring the time between them.
For a correct measurement, at least two rising slopes must be present in the sample range.
Duty cycle
The measurement  Duty cycle is defined as the ratio between the time that a signal is higher than half the amplitude
and the period.
It is expressed as a percentage.
Duty cycle is defined as the ratio between the time that a signal is higher than half the amplitude
and the period.
It is expressed as a percentage.
Duty cycle inverted
The measurement  Duty cycle inverted is defined as the ratio between the time that a signal is
lower than half the amplitude and the period.
It is expressed as a percentage.
Duty cycle inverted is defined as the ratio between the time that a signal is
lower than half the amplitude and the period.
It is expressed as a percentage.
Crest factor
The  Crest
factor is equal to the peak amplitude of a waveform divided by the RMS value.
Crest
factor is equal to the peak amplitude of a waveform divided by the RMS value.

The Crest factor can be used to get an idea of the quality of a signal. A signal with more peaks will have a higher Crest factor. The following table lists some Crest factors for some ideal standard signals.
| Signal type | Crest factor |
|---|---|
| Sine | √2 ≈ 1.414 |
| Triangle | √3 ≈ 1.732 |
| Block | 1 |
| DC | 1 |
Rise time
The  Rise
time is the time it takes for the signal to rise from 10% to 90% of its top-bottom value.
The first rising slope in the sample range is used.
Rise
time is the time it takes for the signal to rise from 10% to 90% of its top-bottom value.
The first rising slope in the sample range is used.
Fall time
The  Fall
time is the time it takes for the signal to fall from 90% to 10% of its top-bottom value.
The first falling slope in the sample range is used.
Fall
time is the time it takes for the signal to fall from 90% to 10% of its top-bottom value.
The first falling slope in the sample range is used.
Slew rate
The  Slew
rate is defined as the change of voltage per unit of time and is expressed in V/s.
The first edge in the sample range is used.
Slew
rate is defined as the change of voltage per unit of time and is expressed in V/s.
The first edge in the sample range is used.
dBm
 dBm is the power ratio
in decibels of the measured power referenced to one milliwatt.
The following formula is used, in which an adjustable virtual reference resistor
Rref is used to convert the measured voltage to power.
The default value of Rref is 600Ω
dBm is the power ratio
in decibels of the measured power referenced to one milliwatt.
The following formula is used, in which an adjustable virtual reference resistor
Rref is used to convert the measured voltage to power.
The default value of Rref is 600Ω

Power
 Power shows the
amount of electrical power that is dissipated in a virtual reference resistor by the measured signal.
The following formula is used, in which an adjustable virtual reference resistor
Rref is used to convert the measured voltage to power.
The default value of Rref is 600Ω
Power shows the
amount of electrical power that is dissipated in a virtual reference resistor by the measured signal.
The following formula is used, in which an adjustable virtual reference resistor
Rref is used to convert the measured voltage to power.
The default value of Rref is 600Ω

Period count
 Period count determines the number of periods in a signal.
It uses the mid level crossings in the signal to determine the amount of periods.
Period count determines the number of periods in a signal.
It uses the mid level crossings in the signal to determine the amount of periods.
For a correct measurement, at least three mid level crossings must be present in the sample range.
Pulse count (positive)
 Pulse count (positive) determines the number of rising pulses in a signal.
It uses the mid level crossings in the signal to determine the amount of pulses.
Pulse count (positive) determines the number of rising pulses in a signal.
It uses the mid level crossings in the signal to determine the amount of pulses.
For a correct measurement, at least two mid level crossings must be present in the sample range.
Pulse count (negative)
 Pulse count (negative) determines the number of falling pulses in a signal.
It uses the mid level crossings in the signal to determine the amount of pulses.
Pulse count (negative) determines the number of falling pulses in a signal.
It uses the mid level crossings in the signal to determine the amount of pulses.
For a correct measurement, at least two mid level crossings must be present in the sample range.
Pulse width (positive)
 Pulse width (positive) determines the width of rising pulses in a signal.
It uses the mid level crossings in the signal to determine the width of pulses.
Pulse width (positive) determines the width of rising pulses in a signal.
It uses the mid level crossings in the signal to determine the width of pulses.
For a correct measurement, at least two mid level crossings must be present in the sample range. When multiple pulses occur in the sample range, the average width of all detected pulses is shown.
Pulse width (negative)
 Pulse width (negative) determines the width of falling pulses in a signal.
It uses the mid level crossings in the signal to determine the width of pulses.
Pulse width (negative) determines the width of falling pulses in a signal.
It uses the mid level crossings in the signal to determine the width of pulses.
For a correct measurement, at least two mid level crossings must be present in the sample range. When multiple pulses occur in the sample range, the average width of all detected pulses is shown.
Rising edge count
 Rising edge count determines the number of rising edges in a signal.
It uses the mid level crossings in the signal to determine the amount of edges.
Rising edge count determines the number of rising edges in a signal.
It uses the mid level crossings in the signal to determine the amount of edges.
For a correct measurement, at least two mid level crossings must be present in the sample range.
Falling edge count
 Falling edge count determines the number of falling edges in a signal.
It uses the mid level crossings in the signal to determine the amount of edges.
Falling edge count determines the number of falling edges in a signal.
It uses the mid level crossings in the signal to determine the amount of edges.
For a correct measurement, at least two mid level crossings must be present in the sample range.
Total Harmonic Distortion (THD)
The Total Harmonic Distortion (THD) is defined as the ratio between the power of the harmonic frequencies above the base frequency and the power of the base frequency. This ratio is displayed in dB. It is a measure of the distortion in a signal.
The THD is calculated using the following formula:

where V1 is the RMS amplitude of the base frequency and V2 to Vn are the RMS amplitudes of each higher harmonic.
The THD measurement can only be used on frequency based signals or spectra.
Left
The measurement Left
can be used in the cursor window.
It is the value of the signal at the position of the left cursor.
Right
The measurement
Right can be used in the cursor window.
It is the value of the signal at the position of the right side cursor.
Right-Left
The measurement
Right-Left can be used in the cursor window.
It is the difference between the magnitude of the signal at the position of the right and left cursor.
Slope
The Slope
of a signal is the change of magnitude divided by the elapsed time.
The measurement slope determines the slope in a signal between the left and the right cursor.

Top
The measurement Top
can be used in the cursor window.
It represents the value of the signal at the position of the top cursor.
Bottom
The measurement
Bottom can be used in the cursor window.
It represents the value of the signal at the position of the bottom cursor.
Top-Bottom
The measurement
Top-Bottom can be used in the cursor window.
It represents the difference between the signal magnitudes at the positions of the top and bottom cursor.
Reference resistor
A user configurable virtual impedance is available that is used by the Power measurement
and the dBm measurement
.
Cicking the  Impedance button in the cursor readout window will allow to set its value.
Its default value is 600 Ω.
Impedance button in the cursor readout window will allow to set its value.
Its default value is 600 Ω.