
A typical application of the Filter I/O is to remove unwanted frequencies from a measurement, which may negatively affect further operations on the measured signal.
For each filter type, the used algorithm and order can be set. Depending on the selected filter type, the cut-off frequency or the center frequency and bandwidth can be set. Depending on the selected filter algorithm, additional settings can be available.
Properties
To control the behavior of the Filter I/O, several properties are available.
These can be accessed through a popup menu which is shown when the I/O is right clicked in the Object Tree.
The properties can also be accessed through its settings window which is shown when the I/O is double clicked in the Object Tree.
To open the Object tree, click the  Show object tree button.
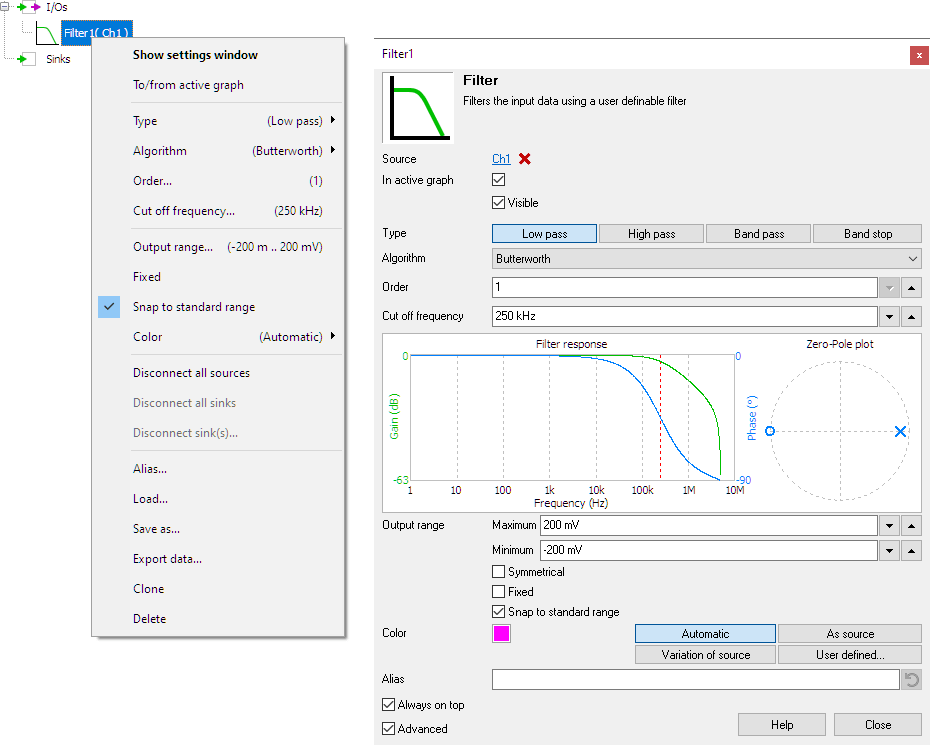
By default, the settings window only shows the most used settings. When Advanced is ticked, the extended window with all settings is shown. See also the program settings.
The Filter settings window also shows a graphical representation of the filter characteristics. A graph with gain and phase is shown as well as a Zero-Pole plot. The Phase graph can be switched between degrees and radians by clicking the axis legend. The frequency axis be switched between linear and logarithmic by clicking the axis legend.
Type
The following filter types are available:
 Low pass filter
 High pass filter
 Band pass filter
 Band stop filter
Algorithm
Depending on the selected filter type, one out of three or four filter algorithms can be selected. Available filter algorithms are:
- Butterworth
- Chebyshev type I
- Chebyshev type II
- Peak (band pass only)
- Notch (band stop only)
A Butterworth filter has a maximally flat pass band so every frequency within this band is not affected. Butterworth filters have a high selectivity.
A Chebyshev filter has ripple on its pass band but it gives a steeper roll off. The user can select how much ripple is allowed on the pass band such that the selectivity gets higher. A lower ripple also means less steepness.
The Chebyshev type I filter allows to set the pass band ripple.
The Chebyshev type II filter allows to set the stop band attenuation.
The Peak algorithm is only available for the Band pass filter.
The Notch algorithm is only available for the Band stop filter.
Order
The Order of a filter defines the steepness of the roll off of the filter. A higher order gives a steeper roll off. Additionally, a higher order also gives a larger phase shift or delay.
Cut off frequency
The Cut off frequency defines the frequency where the output of the filter is -3 dB lower than the input. The Cut off frequency is only available for the Low pass filter and the High pass filter.
Center frequency
The Center frequency defines the center of the band that is either passed or blocked. The Center frequency is only available for the Band pass filter and the Band stop filter.
Bandwidth
The Bandwidth defines the width of the band around the Center frequency where the output of the filter is -3 dB lower than the input. The bandwidth is only available for the Band pass filter and the Band stop filter.
Pass band ripple
The Pass band ripple defines the amount of ripple in the pass band of a Chebyshev type I filter.
Stop band attenuation
The Stop band attenuation defines the attenuation of the stop band of a Chebyshev type II filter.
Common properties and actions
Related information

Multiply / Divide
The Multiply / Divide I/O multiplies or divides data of two ore more sources.
Differentiate
The Differentiate I/O differentiates the source's data.
Ideal filter
The Ideal filter I/O filters the source's data using an ideal user definable software filter.
Signal cleaner
The Signal cleaner I/O cleans up a periodical signal by removing noise and other unwanted distortions from the source's data.