When sampling an analog signal with a certain sampling frequency, signals appear in the output with frequencies equal to the sum and difference of the signal frequency and multiples of the sampling frequency. For example, when the sampling frequency is 1000 Hz and the signal frequency is 1250 Hz, the following signal frequencies will be present in the output data:
| Multiple of sampling frequency | 1250 Hz signal | -1250 Hz signal | ||
|---|---|---|---|---|
| ... | ||||
| -1000 | -1000 + 1250 = | 250 | -1000 - 1250 = | -2250 |
| 0 | 0 + 1250 = | 1250 | 0 - 1250 = | -1250 |
| 1000 | 1000 + 1250 = | 2250 | 1000 - 1250 = | -250 |
| 2000 | 2000 + 1250 = | 3250 | 2000 - 1250 = | 750 |
| ... | ||||
As stated before, when sampling a signal, only frequencies lower than half the sampling frequency can be reconstructed. In this case the sampling frequency is 1000 Hz, so we can we only observe signals with a frequency ranging from 0 to 500 Hz. This means that from the resulting frequencies in the table, we can only see the 250 Hz signal in the sampled data. This signal is called an alias of the original signal.
If the sampling frequency is lower than 2 times the frequency of the input signal, aliasing will occur. The following illustration shows what happens.
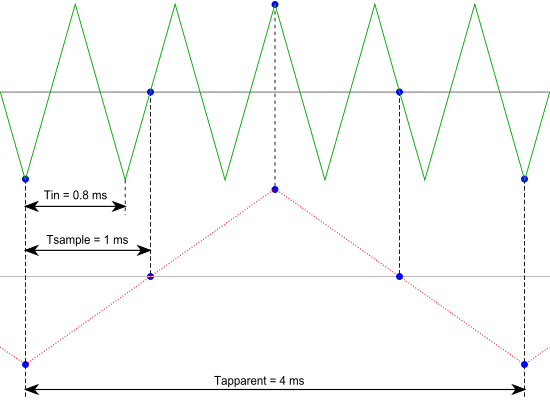
In this picture, the green input signal (top) is a triangular signal with a frequency of 1.25 kHz. The signal is sampled with a frequency of 1 kHz. The corresponding sampling interval is 1/( 1000 Hz ) = 1 ms. The positions at which the signal is sampled are depicted with the blue dots.
The red dotted signal (bottom) is the result of the reconstruction. The period time of this triangular signal appears to be 4 ms, which corresponds to an apparent frequency (alias) of 250 Hz (1.25 kHz - 1 kHz).
In practice, to avoid aliasing, always start measuring at the highest sampling frequency and lower the sampling frequency if required. Use function keys F3 (lower) and F4 (higher) to change the sampling frequency in a quick and easy way. The next illustration gives an example of what aliasing can look like.
In this picture, a sine wave signal with a frequency of 257 kHz is sampled at a frequency of 50 kHz. The minimum sampling frequency for correct reconstruction is 514 kHz. For proper analysis, the sampling frequency should have been approximately 5 MHz.