The Multi Channel oscilloscope software is designed to work with all TiePie engineering WiFi and USB measuring instruments:
-
 WiFiScope WS6 DIFF
-
 WiFiScope WS4 DIFF
-
 WiFiScope WS6
-
 WiFiScope WS5
-
 Handyscope HS6 DIFF
-
 Handyscope HS6
-
 Handyscope HS5
-
 Handyscope HS4 DIFF
-
 Handyscope HS4
-
 Handyscope HS3
-
 Handyscope TP450
-
 Handyprobe HP3
-
 Automotive Test Scope ATS610004DW-XMSG
-
 Automotive Test Scope ATS605004DW-XMS
-
 Automotive Test Scope ATS5004DW
-
 Automotive Test Scope ATS610004D-XMSG
-
Automotive Test Scope ATS605004D-XMS
-
 Automotive Test Scope ATS5004D
Together with these TiePie engineering instruments, the Multi Channel oscilloscope software can be used as:
- Oscilloscope
- Spectrum analyzer
- Data logger
- Multimeter
- Arbitrary Waveform Generator
- Protocol analyzer
For using the TiePie engineering instruments in your own software, or in third party software, visit the libtiepie-hw Software Development Kit pages.
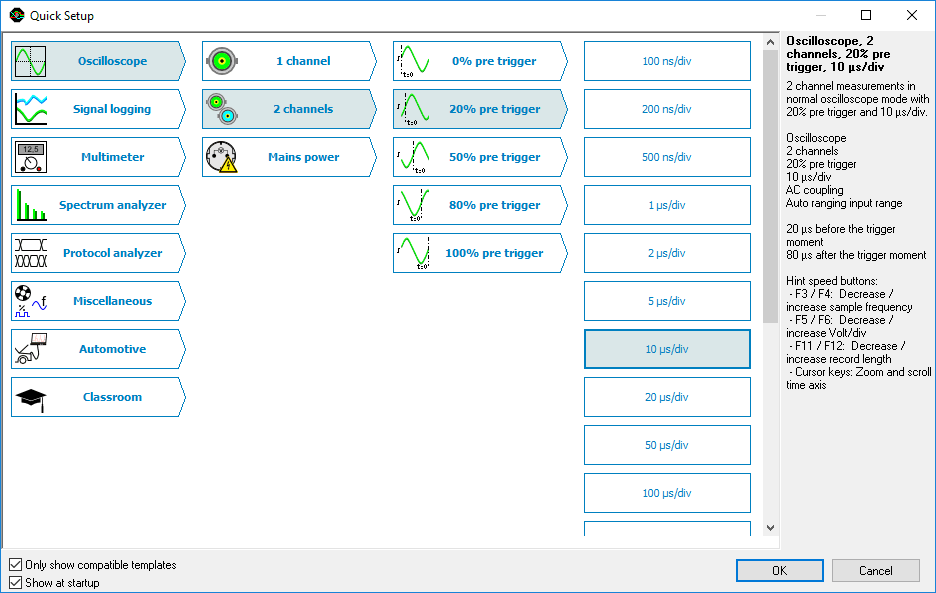
Quick setup
To simplify setting up the measurements, the Multi Channel oscilloscope software contains a large number of Quick Setups, for almost any application. A Quick Setup contains the basic settings for a specific measurement as well as additional information regarding the selected Quick Setup, like e.g. how the instrument and/or accessories need to be connected. Quick Setups can also contain reference signals. After loading the Quick Setup, that specific measurement can be performed and if needed, small adjustments to the setup can be made.
The Quick Setups are carefully organized in a tree structure, ordered by application. Just a few mouse clicks allow to perform a complex measurement.
More info, including an interactive simulation, on the Quick Setups...
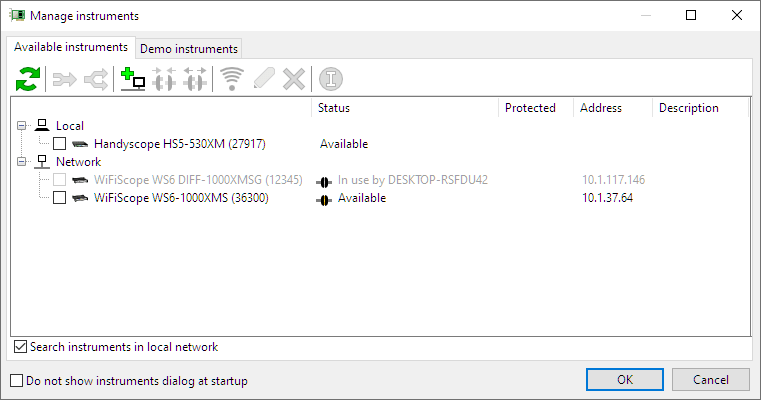
Network support
Remote measuring with a Handyscope series oscilloscope with an ethernet connection (LAN, WiFi or WAN) is so transparent that it appears that the ethernet connected instrument is connected directly to the PC. The Multi Channel oscilloscope software supports ethernet connected instruments by default. All software and hardware features of the oscilloscope, spectrum analyzer, data logger and voltmeter remain available via the network. Specific network knowledge is not required. The dialog with available instruments shows the network instruments. Simply place a tick and measuring can start.
Again, the TiePie engineering motto applies: Plug in and measure
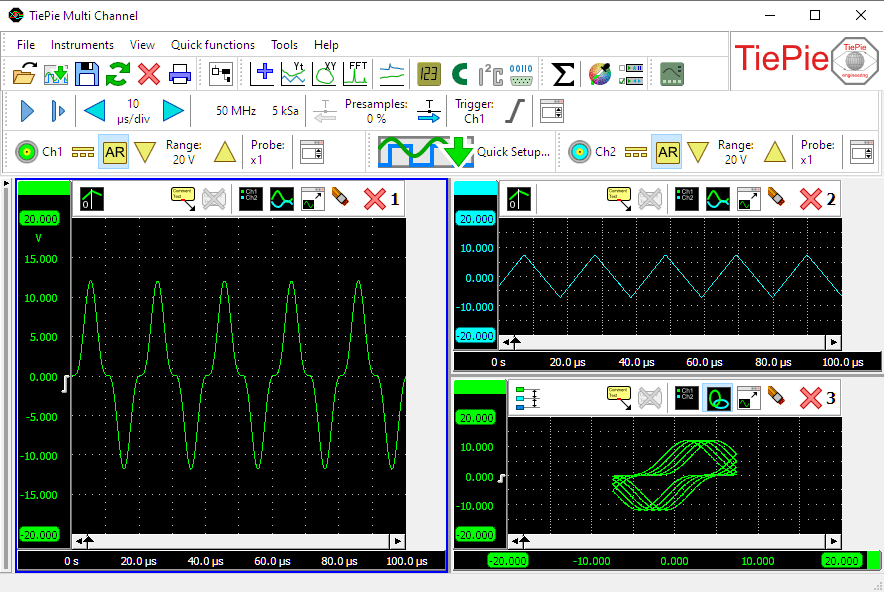
Oscilloscope
An oscilloscope is used to display signal voltages, plotted against time (Yt) or against another signal voltage (XY).
The oscilloscope in the Multi Channel oscilloscope software can have one or more large, fully configurable graphs, where each graph can display different parts of a signal. Measured signals can be copied to reference channels, to compare live signals with earlier measured signals.
Cursors are available in the oscilloscope to make on screen measurements, as well as a t=0 line to indicate the trigger moment. Signals can be given descriptive names and a legend is available to simplify identifying the displayed signals. Text labels can be placed to mark interesting parts of the signal(s).
To reveal all details of the measured signals, the oscilloscopes offer unlimited zooming in both vertical and horizontal direction. All zoom actions can be undone with an undo zoom function.
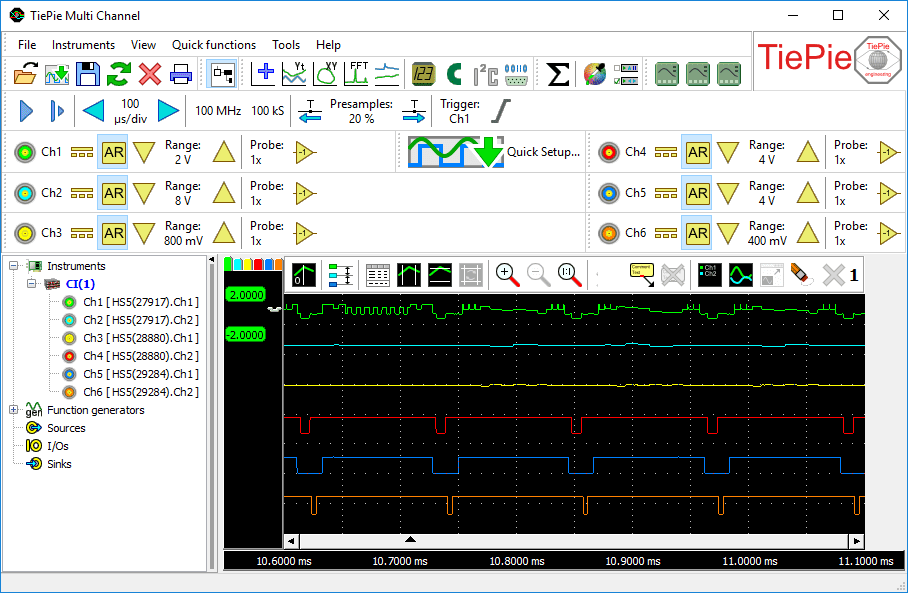
Combining and synchronizing multiple instruments
When two or four measurement channels are not sufficient, the Handyscope and WiFiScope series of instruments offer the possibility to combine and synchronize multiple oscilloscopes to one single oscilloscope with many input channels. Just a coupling cable is required to combine the multiple instruments to a single combined instrument with many channels.
The Multi Channel oscilloscope software combines the individual instruments automatically to a large combined oscilloscope with many input channels which are sampled fully synchronized and can be controlled in one application. You get one oscilloscope.
More information on combining instruments... View multi instrument synchronisation video
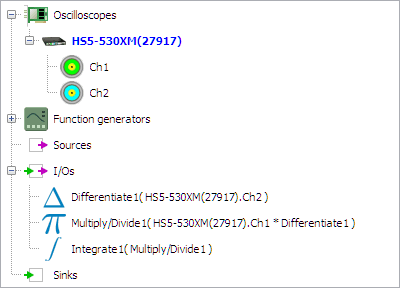
Mathematical functions
The Multi Channel oscilloscope software offers a large variety of mathematical operations like adding, subtracting, multiplying, dividing, integrating, differentiating, determining the square root, determining the logarithm, etc. These mathematical operations are available in the form of I/Os, also called processing blocks, and can be used to process the measured signals and reference signals.
Combining these mathematical processing blocks gives unrivaled possibilities in constructing complex mathematical operations to analyze your measurements thoroughly and obtain all the information you need from your data. The results of the mathematical operations can be displayed in one or more graphs, can be displayed in numeric displays, in tables and can be written to disk in various common file formats.
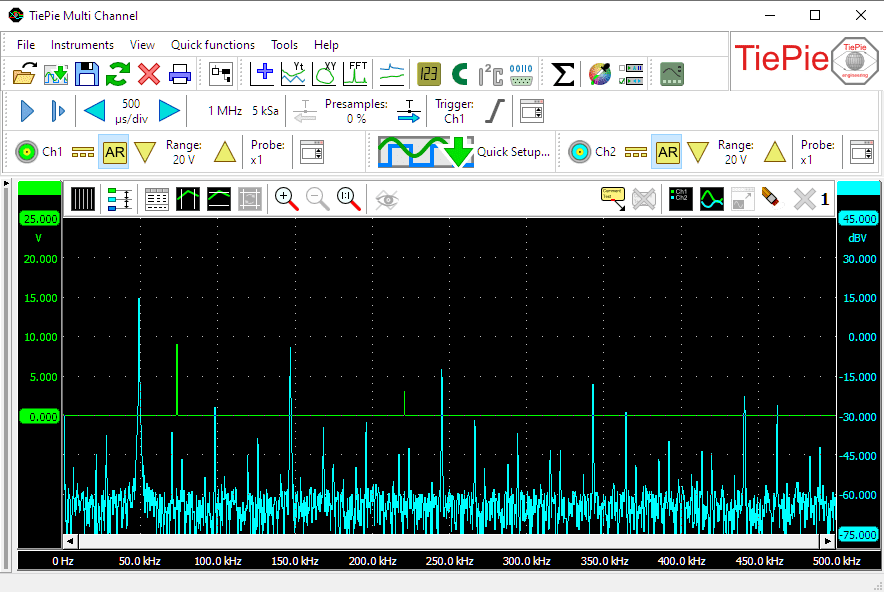
Spectrum analyzer
A spectrum analyzer is an instrument that graphically displays signal amplitude against frequency, in the frequency domain. It will show which frequency components are present in a signal and how strong these are.
- With a spectrum analyzer small harmonic distortions on a signal can be displayed better than on an oscilloscope. A sine wave may look good in the time domain, however in the frequency domain the harmonic distortion is visible.
- A noise signal may look fully random in the time domain on an oscilloscope, in the frequency domain on a spectrum analyzer it can appear that one frequency is dominantly present.
- In the frequency domain it is very simple to determine carrier frequency, modulation frequency, modulation level and modulation distortion from a modulated signal (AM or FM).
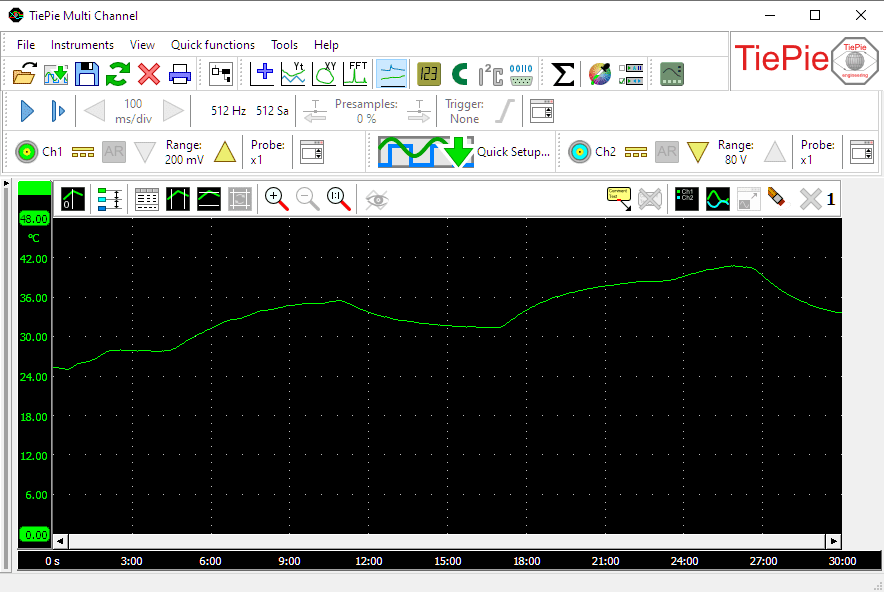
Data logger
A data logger is a direct registering instrument to display signal voltages, plotted against time (Yt) or against another signal voltage (XY).
The data logger is the ideal instrument for measuring slowly changing signals like e.g. the temperature change in a room. While capturing the whole process, any change on the input signal(s) is immediately visible.
Another application for the data logger is to measure long non-repetitive signals like e.g. a serial communication signal, that would last too long to be captured in the internal memory of the hardware.
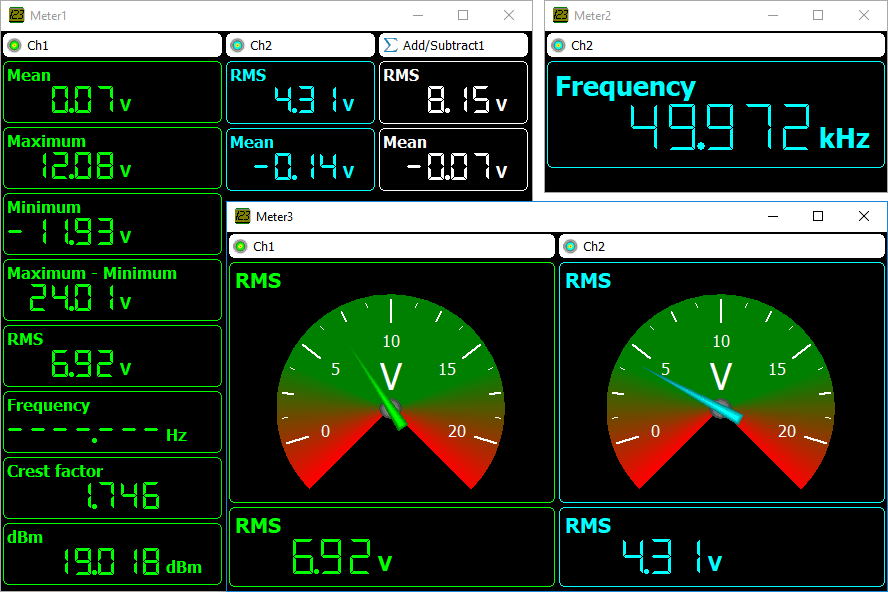
Multimeter
The multimeter is an instrument that performs a measurement on a signal and then determines one or more specific properties of that signal and displays these as numeric values.
The multimeter can be used to measure or monitor specific properties of a signal, like RMS value, frequency, maximum value etc. The Multi Channel oscilloscope software can have any number of fully configurable displays, either displaying the measured value as a number or using a gauge display. When using a gauge display, it can be very helpful when adjusting a circuit for a specific property, e.g. adjusting an offset to zero.
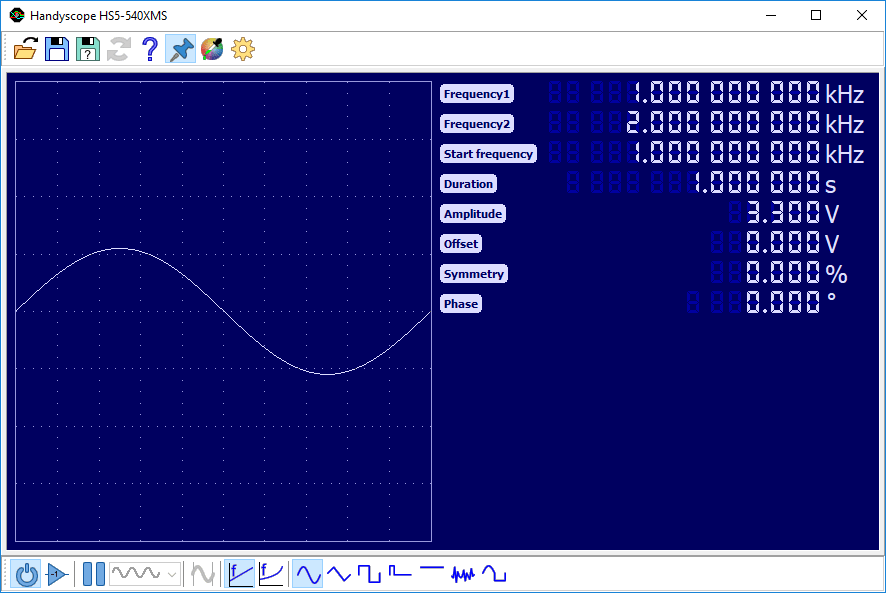
Arbitrary Waveform Generator
An arbitrary waveform generator is an instrument that can generate repetitive or single shot signals. The signals can have a predefined standard shape like a sine wave or a square wave as in a conventional function generator. However, the signals can also have an arbitrary shape, defined by the user. These signals can be created using the Multi Channel oscilloscope software or an external program or can be signals previously measured by the oscilloscope and loaded in the generator.
A function generator is an essential instrument in testing circuits. It can be used to apply a signal to a circuit under test, to test the functionality of that circuit.
A specific application of an arbitrary waveform generator is the ability produce signals that simulate certain external conditions without the need of having the actual condition. An example of this is generating a previously measured crankshaft sensor signal and apply that to the motor management system of a car. Various parts in the motor management system can then be tested without the engine having to run. Also systems relying on serial communication signals can be tested this way.
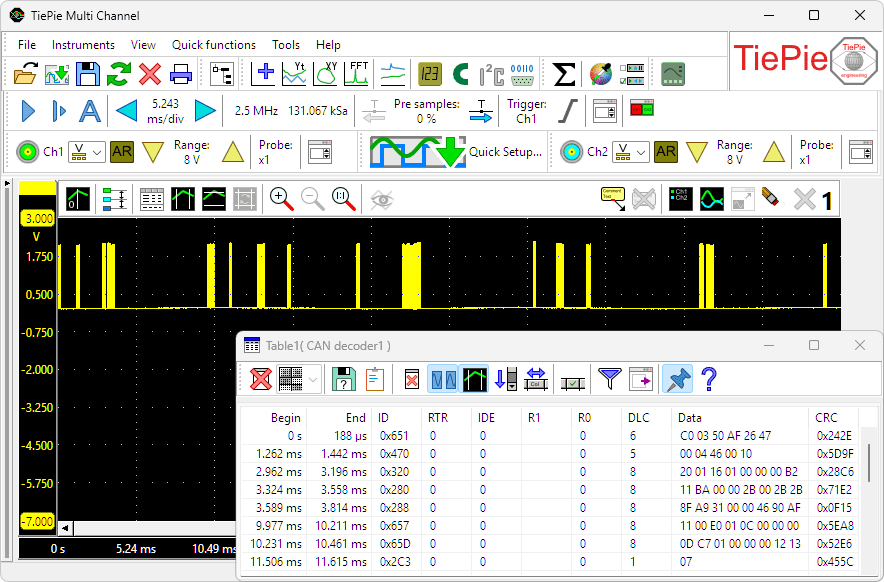
Protocol analyzers
A protocol analyzer is a measuring instrument that analyzes one or more signals that are used to communicate between electronic devices according a specific protocol. A protocol analyzer examines the signals and decodes the information that is transferred. The decoded information can be displayed in graphs, meter sinks and table sinks.
A protocol analyzer is a useful tool when developing a hardware and/or software implementation of a communication bus. It can also be used when debugging device or bus failures.
The Multi Channel oscilloscope software contains the following protocol analyzers:
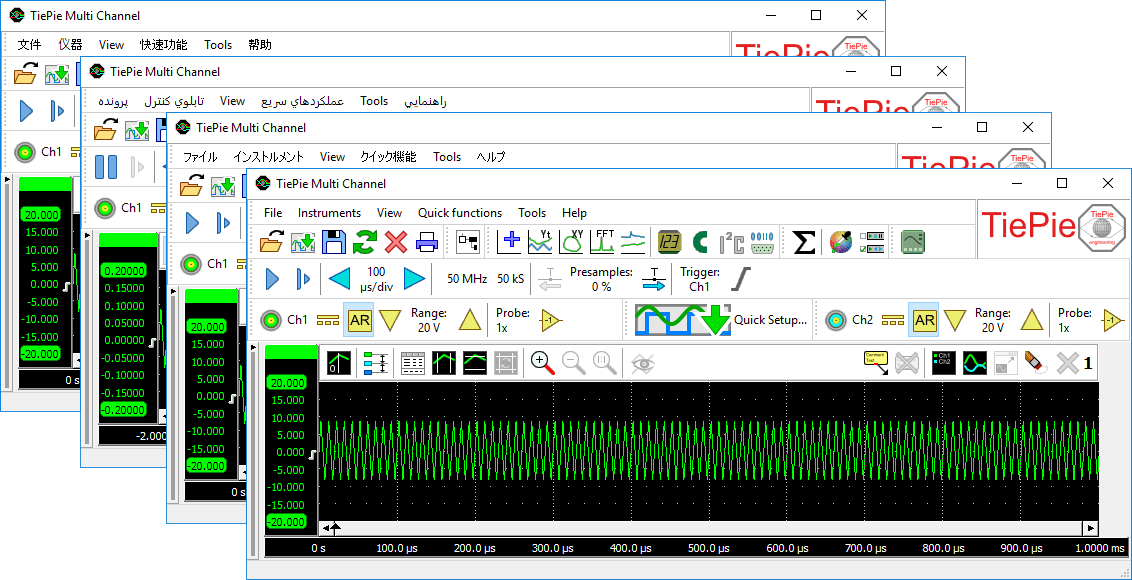
Multi language interface
The user interface of the Multi Channel oscilloscope software can be can be set to many different languages. The following languages are available:
| Brazilian Portuguese / Português do Brasil | Frisian / Frysk | Portuguese / Português |
| Chinese Simplified / 簡體中文 | German / Deutsch | Romanian / Română |
| Chinese Traditional / 繁體中文 | Greek / Ελληνικά | Russian / Русский |
| Czech / Čeština | Hungarian / Magyar | Serbian / Srpski |
| Danish / Dansk | Italian / Italiano | South African / Afrikaans |
| Dutch / Nederlands | Japanese / 日本語 | Spanish / Español |
| English (US) / English (US) | Korean / 한국어 | Swedish / Svenska |
| Farsi / فارسي | Latvian / latviešu | Thai / ไทย |
| Finnish / Suomi | Lithuanian / Lietuvių | Turkish / Türkçe |
| French / Français | Polish / Polski |
Download
Download Multi Channel Software Download Instrument driver
When started without instrument connected, the Multi Channel oscilloscope software operates as demo software.
View the Multi Channel oscilloscope software change log.