A data logger is a direct registering instrument to display signal voltages, plotted against time (Yt) or against another signal voltage (XY).
The data logger will measure in a continuous streaming mode, until it is stopped by the user. While measuring, each time new samples are taken, they will be transferred directly to the computer where they will be processed and displayed and when required stored to disk. Any change in the input signal(s) will be immediately visible. The measurement duration is not limited by the amount of internal memory in the instrument, allowing for very long uninterrupted measurements.
The main difference with the oscilloscope is that the oscilloscope measures a predefined amount of time and stores all measured data internally in the instrument. When all data is measured, all data will be transferred to the computer and then be processed and displayed. After that, a new measurement will be started. This limits the total measuring length to the the size of the available memory inside the instrument. And there will always be a gap between two successive measurements.
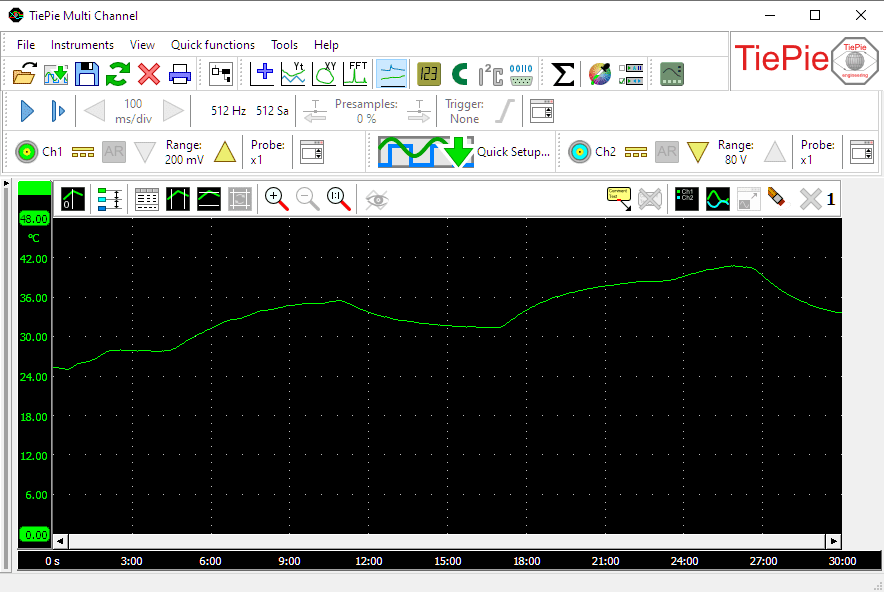
The measuring mode of the data logger / transient recorder makes it the ideal instrument for measuring slowly changing signals like e.g. the temperature change in a room. While capturing the whole process, any change on the input signal(s) is immediately visible.
Another application for the data logger is to measure long non-repetitive signals like e.g. a serial communication signal, that would last too long to be captured in the internal memory of the hardware.
Features of the Multi Channel software data logger
The data logger function in the Multi Channel oscilloscope software has the following features:
Data logger graphs
The data logger can have one or more graphs, each displaying one or more signals, where each graph can display different parts of a signal. Graphs can display the signal(s) in Yt mode or in XY mode, with or without interpolation. Colors of all items in a graph can be set to any required value. Graph dimensions can be adjusted to any required size, graphs can be located in one single window or in separate windows, which can be located anywhere on the desktop.
Cursors are available to make on screen measurements. Signals can be given descriptive names and a legend is available to simplify identifying the displayed signals. Text labels can be placed to mark interesting parts of the signal(s).
Measurements are only limited by the available memory in the computer or the available disk space. To reveal all details of the measured signals, unlimited zooming is available in both vertical and horizontal direction. All zoom actions can be undone with an undo zoom function.
Convenient settings windows
To setup the instrument and the channels, convenient instrument settings windows and channel settings windows are available. They give access to all relevant settings of the instrument and channel, making easy tweaking of settings possible.
Touchscreen friendly toolbars
An instrument toolbar and channel toolbars are available for each detected instrument. The convenient toolbars provide clear buttons for all settings of the instrument and its channels. They show the current settings of the instrument and allow to change all settings. The large buttons are very suitable for touchscreen operation.
The toolbars are fully configurable through the program settings. You can set the button size, add or remove buttons and change the order of the buttons.
Mathematical operations in the data logger
Various mathematical operations can be performed on the measured data. Basic mathematical operations that can be performed are:
- Adding/subtracting
- Multiplying/dividing
- Differentiating
- Integrating
- Determining the square root of a signal
- Determining the absolute value of a signal
These operations can be combined in any thinkable way. The result of a mathematical operation can be displayed in a graph and can also be used as input for another mathematical operation.
More complexe mathematical operations that are available are:
Storing data logger measurement data
Measurement data can be stored in various different ways:
- Saved to disk in various different data file formats
- Printed, with customizable layout and colours
- Stored as image file, in various common formats
Data logger controls
Controlling the data logger is done through customizable instrument and channel toolbars, through instrument and channel settings windows and popup menus and by hotkeys. A quick function toolbar is available for often used functions.