Advanced measurements

Object tree

The Multi Channel oscilloscope software has a modular structure, with measuring instruments, function generators and other objects constructed in the application. Besides measuring data with the TiePie engineering measuring instruments and displaying it like on a conventional scope, it is possible to do different kinds of processing on the measured data. Data can be combined with other measured data or with software generated data.

The objects that can be created, are divided into three groups:

  • Sources: these objects generate data, like software generators. Sources only have output(s) (like the channels of an instrument).
  • I/Os: objects that accept data (Input), process this data in a specific way, like e.g. adding, multiplying, filtering, etc. and then generate the processed data (Output). These objects have input(s) and output(s).
  • Sinks: these objects only accept data, like e.g. graphs and meters and tables. These objects only have input(s).

Objects can be combined and connected to each other to create measurement applications that range from very simple to very complex.

Object tree

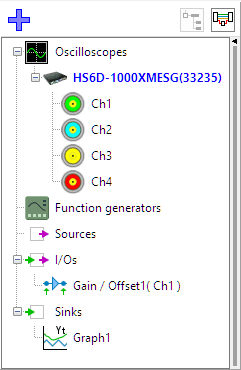
All objects are located in the object tree. The object tree is situated at the left side of the main window of the application. It can be resized by dragging the splitter bar at the right of the object tree. It can be revealed and hidden by clicking the Show object tree Show object tree button on the main toolbar or by clicking the small triangle at the upper right corner of the object tree. In the application settings can be determined whether the object tree is default visible or hidden. The status of the Object tree (visible or hidden) is also saved when a measurement is saved and restored when that measurement is loaded again.

Creating objects

A new source, I/O or sink is created by right clicking on the root item in the object tree and selecting the object of your choice from the popup menu. In the figure below the "I/Os" item is clicked with the right mouse button.

To demonstrate two SoftGen sources and an Add / Subtract I/O object will be created. The signal type of the second SoftGen source will be set to "square".

Create an I/O
Figure 1: Create an I/O
Set SoftGen to square signal
Figure 2: Set SoftGen to square signal

Connecting objects

To make an object process the data from a source, that source must be connected to the object. With drag and drop, the different objects in the object tree can be connected to other objects. To connect a source object to a sink object or I/O block, it must be dragged on it with the mouse. When the source is dropped it will connect to the object it was dropped on.

In the example in the figure below, the two SoftGens that were just created are dropped onto the Add / Subtract. The Add / Subtract displays its sources between braces.

Connect example

The output of the Add / Subtract I/O now contains the signals of the two SoftGens, added together. To display this result in e.g. a graph, drag the Add / Subtract I/O in a graph. Double clicking the Add / Subtract I/O will show it in the active graph.

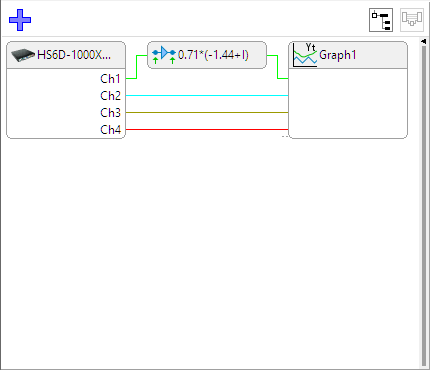
When a source with multiple outputs (e.g. an instrument) is dropped on an I/O or sink with one input, the I/O or sink is cloned multiple times and each output of the source is connected to such an I/O or sink.

Connect multiple example

Connecting objects between other objects

To connect an object between two objects that are already connected to each other, first the two objects have to be disconnected from each other. Then the new object can be placed between them.

Suppose a streaming measurement is performed where Channel 1 is connected to a Data Collector I/O and the data needs to be low pass filtered before collecting it in the Data Collector I/O. The steps to do that are:

  1. Right-click the Data Collector I/O and select Disconnect all sources from the popup menu.
  2. Create a Low Pass Filter I/O that has to be connected between Channel 1 and the Data Collector I/O.
  3. Connect Channel 1 to the Low Pass Filter I/O by dragging and dropping Channel 1 on the Low Pass Filter I/O.
  4. Drag and drop the Low Pass Filter I/O on the Data Collector I/O.

The Low Pass Filter I/O is now connected between Channel 1 and the Data Collector I/O.

Displaying data

The data of all sources, channels and outputs of I/Os can be displayed in different ways. Usually the data is displayed in a graph, but it is also possible to display the data as numerical values with a meter object or table.

Displaying data in a graph

To display data in a graph, the source object must be connected to a graph. Double clicking the source or right-clicking the source and selecting To/from active graph will add a line for the source in the active graph. When the source has multiple outputs, all outputs will be added to the graph. A source can also be dragged from the object tree onto a graph. The location where the source is dropped determines if the new scale is created at the left or right side of the graph. If a source if dropped in the left half of the graph, the new scale will be at the left. Otherwise the new scale will be at the right.

A source can also be dropped onto an already existing axis if it has the same unit.

Displaying data in Yt mode

To display data in Yt mode the source has to be dropped into an Yt graph. Let's drop the Add / Subtract object we have just created onto a graph:

Display in Yt

Displaying data in XY mode

To display data in XY mode the two sources for each XY-line have to be dropped into an XY graph. In the animation below, two SoftGens are used. SoftGen1 contains a sine wave of 10000 Hz (default). SoftGen2's frequency has been changed to 11000 Hz.

First the graph is set to XY mode by clicking on the XY button on the graph's toolbar. After that, SoftGen1 is dropped on the left half of the graph, resulting in a new scale at the left. A blinking bottom scale will be created, signaling that it needs a source. SoftGen2 is dropped on the bottom scale and XY plot of SoftGen1 versus SoftGen2 is shown.

Display in XY

Displaying data as numerical values with a meter

To display data in a Meter, first a meter needs to be created. Follow the procedure as with creating the other objects: right-click "Sinks" and choose "Meter". Now drag the Add / Subtract onto the Meter. The result can be seen below.

Display in meter

Controlling objects

Actions and settings of individual objects can be accessed by right clicking the object in the object tree. This will show a popup menu with all actions and settings of that object. The properties can also be accessed through the settings window of the object which is shown when the object is double clicked.

Multiple objects can be selected in the object tree by holding the Shift key down and left clicking the first and last of the required objects. Now all actions that the selected objects have in common, can be executed simultaneously on all selected object, by right clicking one of the selected objects and selecting the required action from the popup menu.

Another possibility with multiple selected objects is that they can be saved in a TPO file, including the connections between the selected objects. Opening this TPO file creates all saved objects and restores their interconnections.

The data in any object can be exported to disk, in several common file formats.