November 23, 2022
Version 1.45 of the Multi Channel oscilloscope software is now available for download.
A lot of changes have been made to add new functionality and to improve basic operations in the software. This is a categorized overview of some of the changes.
Contents
- 1 User presets and worksets
- 2 Auto setup window
- 3 New signal analyzing I/Os added
- 3.1 Maximum I/O
- 3.2 Minimum I/O
- 3.3 Maximum - Minimum I/O
- 4 Signal analyzing I/Os improved
- 4.1 RMS I/O
- 4.2 Pulse decoder I/O
- 5 Signal clipping indicators added to graphs and meters
- 6 Settings windows for channels and I/Os improved
- 7 Expression handling in number input fields improved
- 8 Exporting data from graphs improved
- 9 Add markers to a graph while logging data
- 10 Other changes
- 11 New driver
User presets and worksets
When you have several often used measurement setups, an easy and convenient way to handle these is to store them as user presets. A user preset contains instrument settings, software desktop settings like which I/Os are used and what is being shown in the graph(s), etc. and measured data.
A user preset is stored with the software and is then accessible via a User preset button on the preset toolbar.

User presets are easily created, altered or removed with a single mouse click. They can be given a descriptive name which is shown when the preset button is hovered with the mouse.
When you have multiple applications that each require their own User presets, the User presets can be organized in Worksets, to keep a better overview and easier access. The Multi Channel oscilloscope software can handle an unlimited amount of worksets, with each up to 20 user presets.
Read more on User presets and worksets.
Auto setup window
When an unknown signal is connected to the oscilloscope, the easiest way to setup the oscilloscope is by using the auto setup function. It will change various settings of the instrument in order to display a signal in a convenient way for the user: stably triggered, with 2 to 6 cycles of the signal captured.
Clicking the  Auto setup button located on the instrument toolbar opens the Auto setup window.
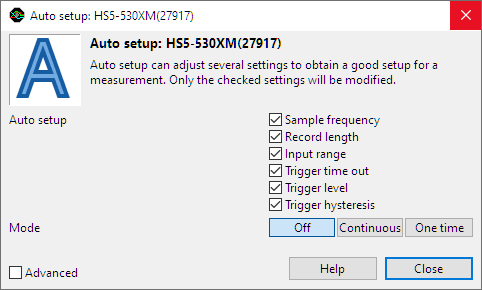
In this window is determined which instrument settings can be adjusted by the software to get to the most useful setup for the connected signal.
The Auto setup mode determines how the Auto setup is executed:
- One time the Auto setup is executed once, when the One time button is clicked.
- Continuous the auto setup is executed continuously, to make the required adjustments when the input signal changes.
- Off the Auto setup is switched off
Mode Continuous can be used to track constantly changing signals, to keep them clearly displayed.
New signal analyzing I/Os added
A number of new I/Os have been added to the software, to help analyze your signals and get the most information from it.
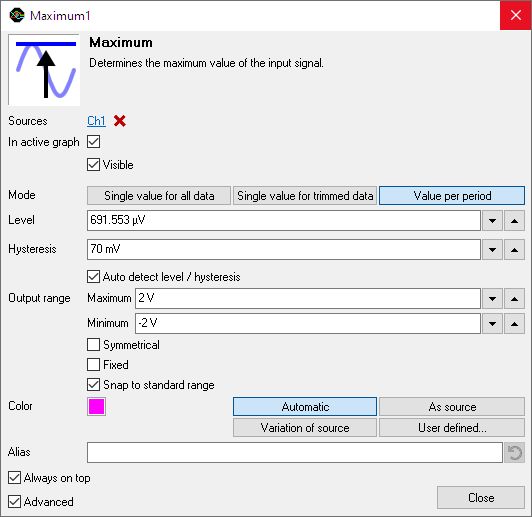
Maximum I/O
A Maximum I/O is added to the software. It determines the maximum value in a signal, either per period or over the total record.
A typical application is to log maximum values of a signal, e.g. mains voltage.
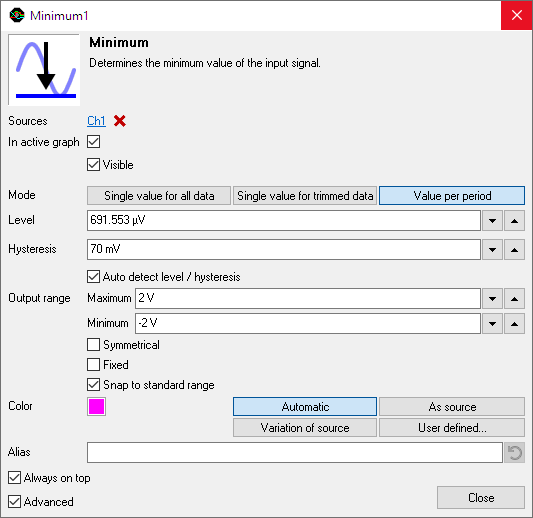
Minimum I/O
A Minimum I/O is added to the software. It determines the minimum value in a signal, either per period or over the total record.
A typical application is to log minimum values of a signal, e.g. mains voltage.
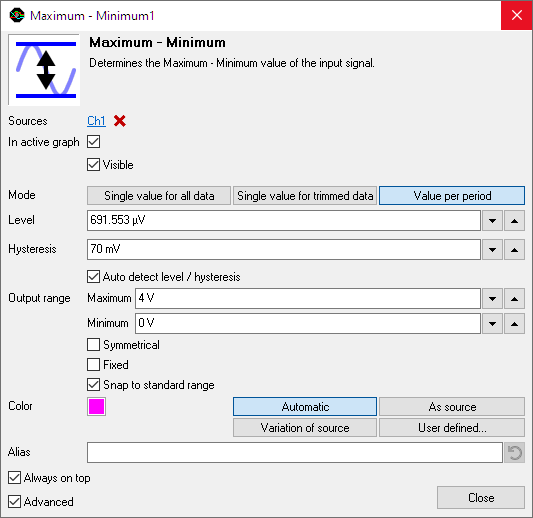
Maximum - Minimum I/O
A Maximum - Minimum I/O is added to the software. It determines the Maximum - Minimum value or peak to peak value of a signal, either per period or over the total record.
A typical application is to log peak to peak values of a signal, e.g. mains voltage.
Signal analyzing I/Os improved
A number of I/Os have been improved, to help analyze your signals better and get even more information from it.
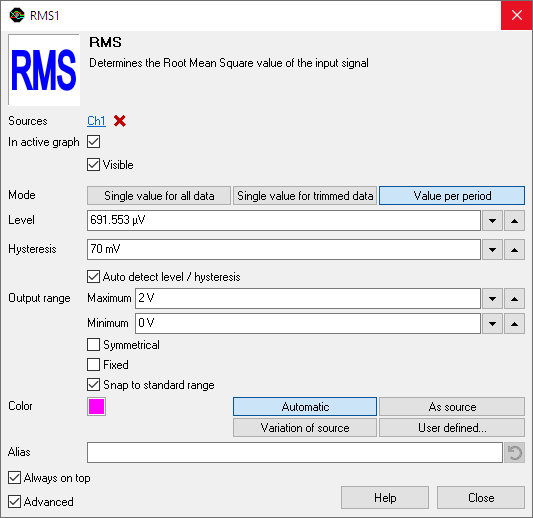
RMS I/O
The RMS I/O is improved. A Mode property is added that allows to determine the RMS value over the total measurement or per period in the input signal individually.
A typical application is to log RMS values of a signal, e.g. mains voltage.
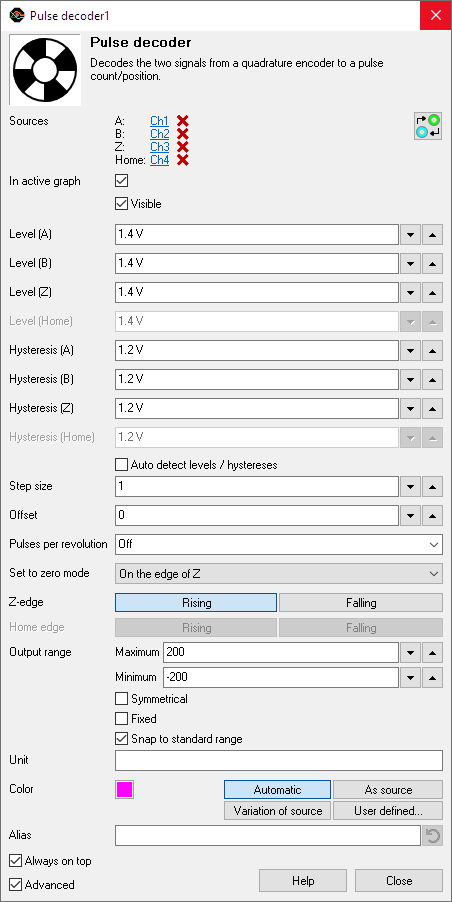
Pulse decoder I/O
The Pulse decoder I/O is improved. It now has to additional inputs, Z and Home.
The Z input can be used to connect to the Z output of an incremental encoder. This output generates one pulse per revolution of the encoder. It can be used as zero point reference.
The Home input can be connected to a Home signal on a machine with one or more encoders. This Home signal is used by the machine controller, in combination with the encoder(s) to control its state.
Corresponding settings Set zero mode, Z edge and Home edge are added to handle the Z and Home input signals.
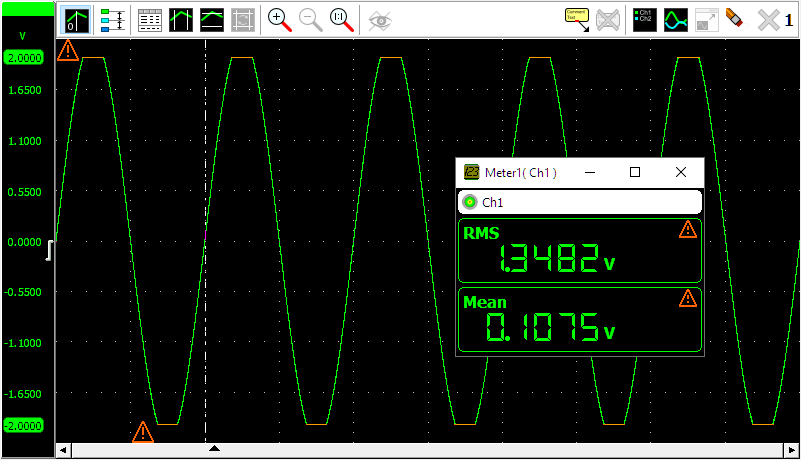
Signal clipping indicators added to graphs and meters
When the input signal is larger than the selected input range and auto ranging is disabled, the input signal will clip at the limits of the input range. Depending on the signal that is being measured, this may not always be clearly visible in the graph or meter. As a result, the measurements can be misinterpreted, resulting in errors.
To avoid that, clipping detection has been added for graphs and for meters. When clipping detection is enabled, the software will place indicators in the graph and/or meter display when the signal is clipped due to being larger than the input range.
Settings windows for channels and I/Os improved
Several modifications have been made in the settings windows for instruments, channels and I/Os.
The settings windows now have an Advanced setting. By default, the settings windows only show the most used settings. When Advanced is ticked, the extended window with all settings is shown. Read more on enabling the Advanced setting in the program settings.
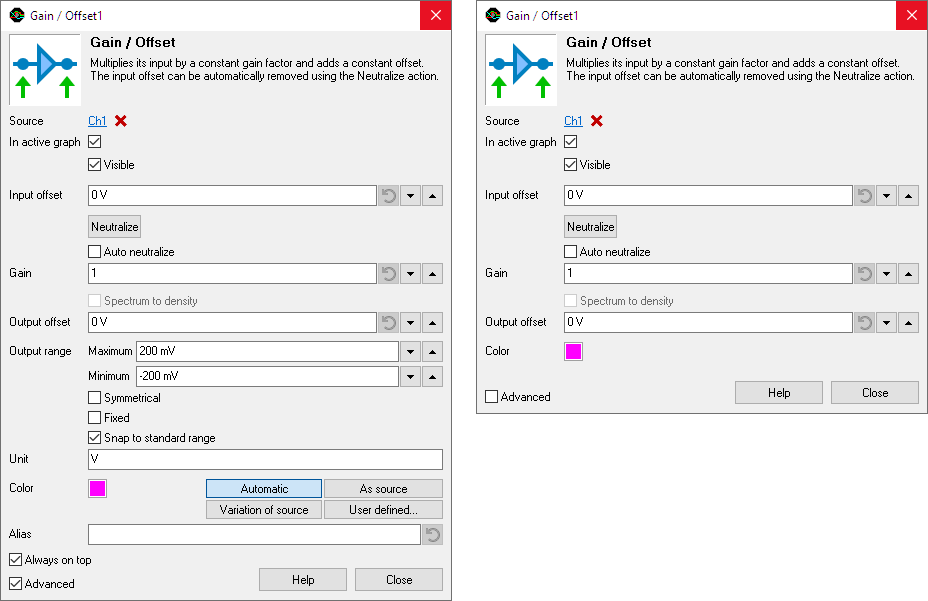
The buttons to add or remove the channel or I/O to or from the active graph and whether the line is visible, have been changed to check boxes to give easier control.
A color indicator for the line color of the channel or I/O is added.
Expression handling in number input fields improved
In many locations in the software, it is possible to enter a numerical value, e.g. to set the gain value of a Gain / Offset I/O.
Entering numbers can now be done in various ways:
- as plain number, e.g. 1200
- in scientific notation, e.g. 1.2e3
- using prefixes, e.g. 1.2k or 1k2
- as an expression, e.g. 10 * ( 100 + 20 )
Expressions can besides numbers also use parentheses (always in pairs), constants and mathematical functions.
Any expression that is entered, will be evaluated by the software and the resulting value is used. The expression will be kept, to make later changes easier. The expression is also saved when saving a setup to a .TPS file and reloaded when that file is later reloaded.
For more info, read using expressions in number input fields.
Exporting data from graphs improved
Exporting data from graphs is improved.
When exporting data from a graph with multiple sources (lines), all files types that can save at least one of the sources can now be selected. If the sources can not be saved together in one file, for example because they have a different time base, they are saved in separate files.
When exporting data from a graph, only data from lines that are visible is exported. Data from lines that are hidden is not exported.
Add markers to a graph while logging data
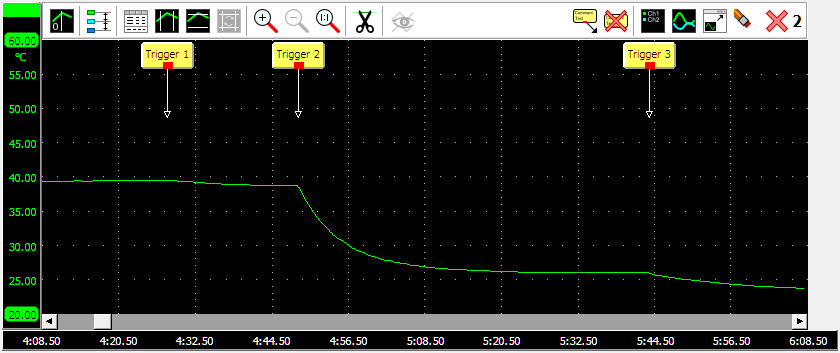
When performing a streaming measurement and a Data collector I/O is shown in the active graph, pressing the Space bar will add a comment to the active graph, at the time location corresponding to the current time. The comment will contain the text Trigger and a serial number, 1 for the first one that is placed, 2 for the second one that is placed, etc. This can be used to mark specific moments during the streaming measurement.
Read more on placing markers while data logging.
Other changes
Several other, less prominent changes are made to the software:
- Streaming is optimized in the low level routines, resulting in the higher streaming rates to be better achievable on more computers.
- In the trigger settings window:
- Added pre trigger position selector
- Added pre samples valid checkbox.
- Added a trigger level mode selector.
- Fixed trigger timeout setting not available when trigger source None was selected
- The table shown when connected to a CAN decoder default shows the Ack column.
- EMI reference signals are added and updated to match the EN 55011:2016 standard
- The Trigger Hold-Off item in the instrument menu and settings window is replaced by a Presamples valid checkbox item.
- The Arrange axis action in a graph, is changed to a mode.
- When changing the sampling rate in streaming mode, it is attempted to keep the ratio between record length and Sampling rate the same.
- Changed the default record length and sample frequency for instruments, based on their model and connection (USB, LAN or WiFi).
- The DiskWriter default file format is set to CSV.
- The user interface languages German, Japanese and Polish have been updated. Most of the Quick setups are now also available in Spanish.
- Many other smaller improvements and corrections
New driver
This new version of the Multi Channel oscilloscope software requires a new driver to be installed on the computer, version 10.0. The installer for the driver is included in the installer of the Multi Channel oscilloscope software and can be optionally executed, if not yet installed.
This new driver is not compatible with the previous driver. This means:
-
With the old driver (version 8.1.9 or older) installed:
- the new Multi Channel oscilloscope software version 1.45 will not be able to connect to instruments via USB.
-
With the new driver (version 10.0) installed:
- older Multi Channel oscilloscope software (version 1.44.1 or older) will not be able to connect to instruments via USB.
- own developed software based on LibTiePie 0.9.16 or older will not be able to connect to instruments via USB.