Graph schemes
For saving images, various parts of the graph can be customized. These settings are combined in an graph scheme. Several default schemes can be selected from. It is also possible to define own schemes, which can be saved for later use. Graph schemes can be used for:
- Displaying graphs
- Printing graphs
- Saving graphs as image
Several graph scheme items can be adjusted. They can be divided into colors and on/off settings.
Adjustable colors
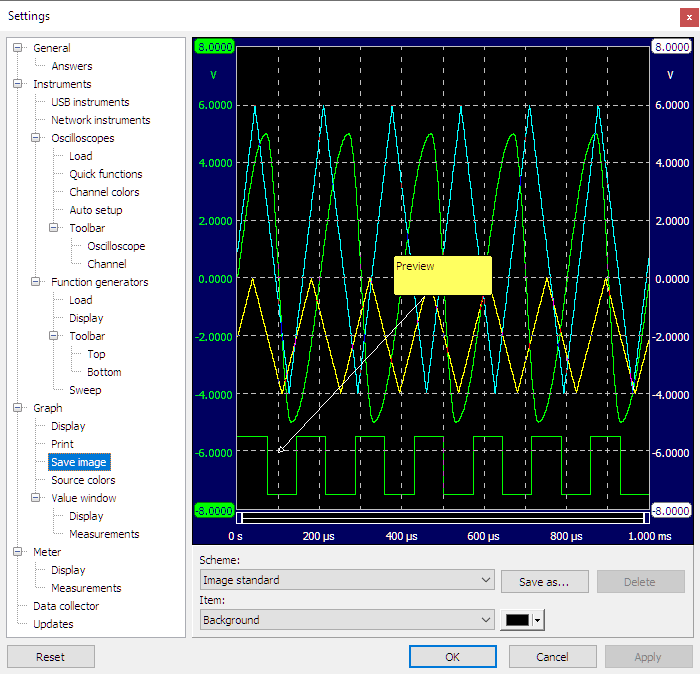
Colors may be changed by pressing a color selector button which opens a color selector dialog with several predefined colors and an option to define other colors. The following colors in a graph scheme can be adjusted:
Background
The background color is used for the background of the graph, as well as for background color of the record view indicator below the graph and the background color of the cursor readout.
Grid
The grid color is used for the grid in the graph and for the legend text.
Axis text
The axis text color is used as text color for axes that are shared by multiple signals. It is also the foreground color of the record view indicator below the graph, the color of the trigger symbol and the text and line color of the cursor readout.
Scale background
The scale background color is used as background color of the axis scales and the area surrounding the graph, as well as for the background color of the table headers of the cursor readout.
Comment background
Comment background is the background color of comment memo's.
Comment text
Comment text is the text color of comment memo's.
Cursors
The cursors color is the line color of the cursors.
Warning color
The warning color is the color for the warning symbols that are shown when the input signal is clipped at the input range.
Adjustable on/off settings
Several graph scheme items can be turned on or off with a check box. The following on/off settings in a graph scheme can be adjusted:
Always use default color
The property always use default color determines whether the normal axis colors are used for the vertical axes and signals (off) or that the axis text color is used for the vertical axes and signals (on).
Show legend
The property show legend determines whether the legend will be visible or not.
Show markers
The property show markers determines whether markers will be drawn in signal lines.